Part 1 : Direction
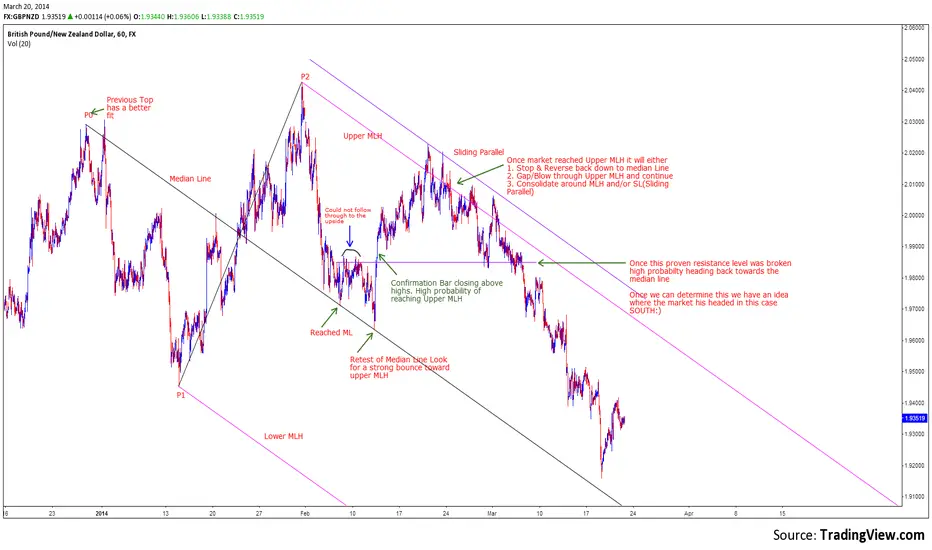
This is a 60 minute chart of the GBP/NZD pair. It was drawn after the first touch of the median line.
The horizontal purple support & resistance line within the median line set gives us directional bias as to market direction. In part two I will zoom in closer and see what the forks are telling me.
This is a 60 minute chart of the GBP/NZD pair. It was drawn after the first touch of the median line.
The horizontal purple support & resistance line within the median line set gives us directional bias as to market direction. In part two I will zoom in closer and see what the forks are telling me.
إخلاء المسؤولية
لا يُقصد بالمعلومات والمنشورات أن تكون، أو تشكل، أي نصيحة مالية أو استثمارية أو تجارية أو أنواع أخرى من النصائح أو التوصيات المقدمة أو المعتمدة من TradingView. اقرأ المزيد في شروط الاستخدام.
إخلاء المسؤولية
لا يُقصد بالمعلومات والمنشورات أن تكون، أو تشكل، أي نصيحة مالية أو استثمارية أو تجارية أو أنواع أخرى من النصائح أو التوصيات المقدمة أو المعتمدة من TradingView. اقرأ المزيد في شروط الاستخدام.