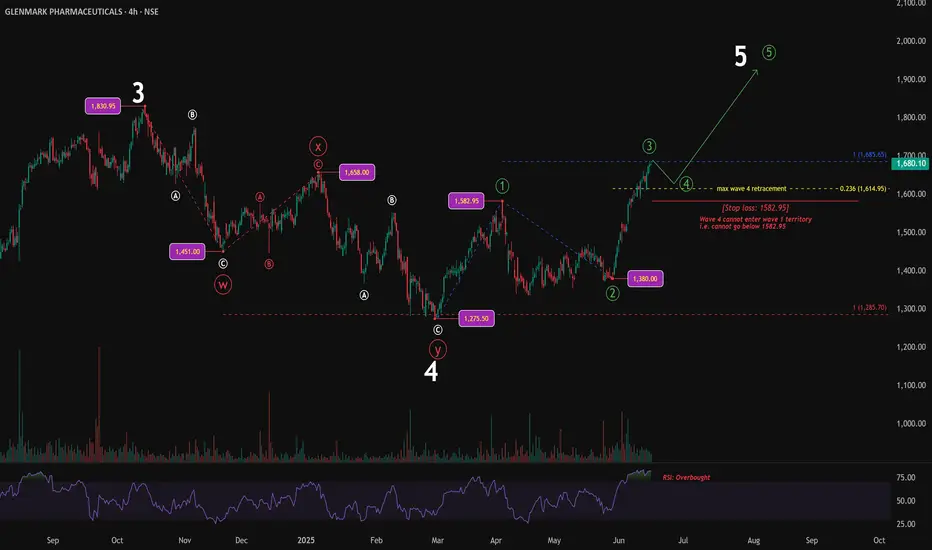
After completing a W-X-Y corrective structure, price has started moving higher in what appears to be a new impulse wave. Within this sequence, Wave 3 seems to have topped at 1685.65, which is 100% of Wave 1 measured from the Wave 2 low — a common relationship in impulse extensions.
Wave 1 had ended at 1582.95, and Wave 2 retraced deeply to 1380, falling beyond the 0.618 Fibonacci level. As per the rule of alternation, since Wave 2 was deep, Wave 4 is expected to be shallow. A possible support zone lies near the 0.236 retracement level at 1614.95.
For the structure to remain valid, Wave 4 must stay above the Wave 1 high. If price breaks below 1582.95, it would invalidate the current impulse count and suggest that this may not be Wave 5.
RSI reached the overbought zone during the final part of Wave 3, which supports the idea of a pullback unfolding. As long as price respects the invalidation level, the setup remains intact and points toward a potential Wave 5 advance.
The chart will be updated as price action evolves.
Disclaimer: This analysis is for educational purposes only and does not constitute investment advice. Please do your own research (DYOR) before making any trading decisions.
ملاحظة
If Wave 4 enters the price territory of Wave 1 by breaking below 1582.95, the entire green 1-2-3-4-5 structure may be reinterpreted as a leading diagonal in Wave 1, since leading diagonals are only permitted in Wave 1 or Wave A positions.ملاحظة
Update (2025-06-19):An alternate scenario is emerging. If Wave 4 fails to hold above 1582.95 and price breaks below this level, the entire advance from 1275.50 may not be an impulse but rather a corrective move unfolding as an abc structure. This would turn the current sequence into a potential X2 connector, opening the possibility for further downside in the form of Wave Z. In that case, the overall decline from 1830.95 may evolve into a larger W-X-Y-X2-Z complex correction. The 1582.95 level remains critical for maintaining the original impulse count.
It may also be noted that Glenmark Pharmaceuticals recently received five procedural observations from the USFDA inspection (link below). While there were no data integrity issues reported, such developments sometimes add near-term pressure to price behavior.
in.tradingview.com/news/mtnewswires.com:20250618:G2517405:0/
WaveXplorer | Elliott Wave insights
📊 X profile: @veerappa89
📊 X profile: @veerappa89
إخلاء المسؤولية
لا يُقصد بالمعلومات والمنشورات أن تكون، أو تشكل، أي نصيحة مالية أو استثمارية أو تجارية أو أنواع أخرى من النصائح أو التوصيات المقدمة أو المعتمدة من TradingView. اقرأ المزيد في شروط الاستخدام.
WaveXplorer | Elliott Wave insights
📊 X profile: @veerappa89
📊 X profile: @veerappa89
إخلاء المسؤولية
لا يُقصد بالمعلومات والمنشورات أن تكون، أو تشكل، أي نصيحة مالية أو استثمارية أو تجارية أو أنواع أخرى من النصائح أو التوصيات المقدمة أو المعتمدة من TradingView. اقرأ المزيد في شروط الاستخدام.