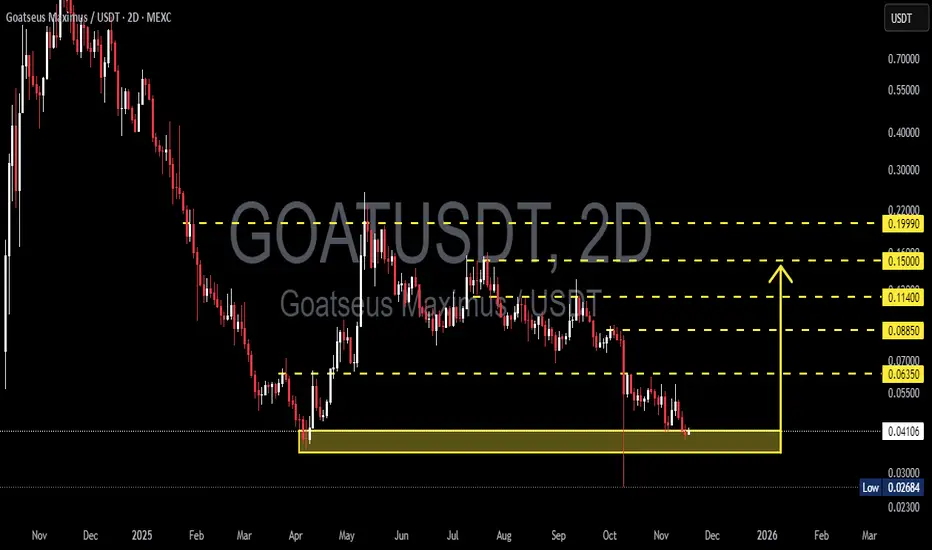
GOAT is now sitting at the most critical level since its earlier distribution phase: the price has returned to retest the Primary Structural Base at 0.041–0.035, a zone that previously triggered a major bullish expansion.
This area is not just support — it is the battleground that decides the next macro direction.
The entire downtrend from the peak has formed a consistent descending wave structure, yet each drop into the 0.041–0.035 block has been met with aggressive buy absorption. This indicates that a large liquidity cluster sits within this zone and may act as the pivot for a significant reversal.
---
Pattern & Market Structure Overview
Price action is currently forming a low-compression pattern into the key support.
This typically ends with either:
a strong impulsive reversal, or
a high-momentum breakdown into deeper liquidity zones.
The latest 2D candle closed right above the upper boundary (0.041), showing buyers are still defending — but the momentum remains fragile.
Overhead resistance levels (0.0635 → 0.0885 → 0.114 → 0.150 → 0.1999) form a clean ladder of recovery targets if a bounce is confirmed.
---
Bullish Scenario — “Major Accumulation Rebound”
This scenario activates if:
1. Price holds and rebounds strongly from 0.041–0.035.
2. A clean 2D close above 0.0635 appears — this zone is the Bullish Trigger.
Once confirmed, the market shifts from a downtrend into a recovery structure, with step targets:
0.0635 → Reversal validation
0.0885 → Momentum expansion
0.114–0.150 → Mid-range trend shift
0.1999 → Major structural retest
From the support zone to the upper targets, the upside potential can reach +300%, but only with full bullish confirmation.
---
Bearish Scenario — “Liquidity Flush Breakdown”
A strong breakdown below 0.035 signals buyer exhaustion.
If that occurs:
Price will likely drop quickly into 0.02684 (previous liquidity wick).
If 0.02684 fails, the chart may enter a capitulation phase, opening the path toward the low 0.02 region.
This would confirm the continuation of the primary downtrend.
---
Core Conclusion
GOAT is positioned inside a macro decision zone.
The 0.041–0.035 range determines whether we see:
the end of the prolonged bearish cycle and the beginning of a major reversal, or
the start of a deeper capitulation leg, as the market hunts lower liquidity.
This makes the zone both the highest-reward entry area and the highest-risk failure point.
#GOATUSDT #GOAT #CryptoAnalysis #PriceAction #SupportZone #Breakout #BullishScenario #BearishScenario #CryptoTA #TechnicalAnalysis
✅ Get Free Signals! Join Our Telegram Channel Here: t.me/TheCryptoNuclear
✅ Twitter: twitter.com/crypto_nuclear
✅ Join Bybit : partner.bybit.com/b/nuclearvip
✅ Benefits : Lifetime Trading Fee Discount -50%
✅ Twitter: twitter.com/crypto_nuclear
✅ Join Bybit : partner.bybit.com/b/nuclearvip
✅ Benefits : Lifetime Trading Fee Discount -50%
إخلاء المسؤولية
The information and publications are not meant to be, and do not constitute, financial, investment, trading, or other types of advice or recommendations supplied or endorsed by TradingView. Read more in the Terms of Use.