Gold Price Action Analysis - Potential Wave 5 Setup (sub waves within Wave A going down)
Wave Structure Overview
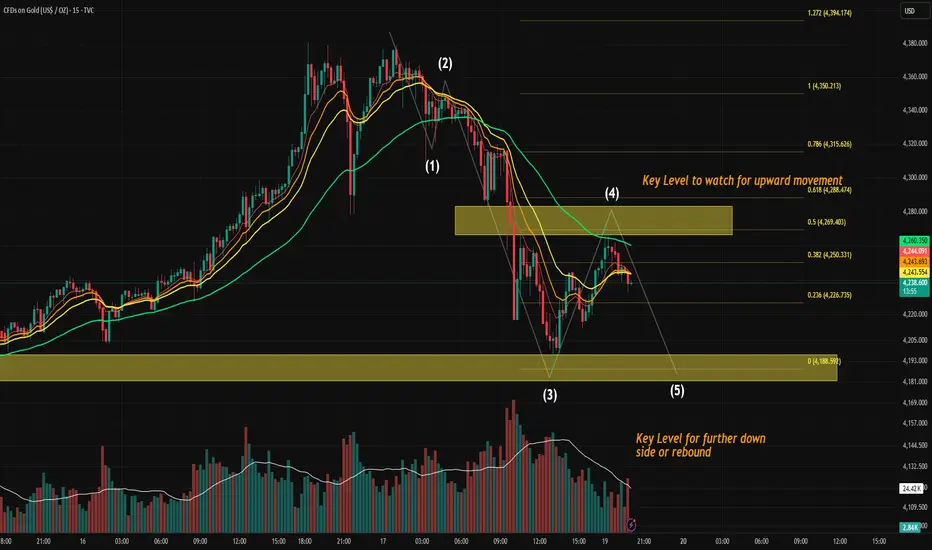
The current structure on the 15-minute chart appears to be unfolding in a classic 5-wave impulsive sequence:
Wave (1) — Initial sell-off following local top formation.
Wave (2) — Sharp retracement, testing previous supply, rejected at previous premarket range high (Friday US Stocks premarket high)
Wave (3) — Strong impulsive move down with expanding volume, typical of a wave 3 extension.
It respected one of our previous opening range high (lower yellow level).
Wave (4) — Counter-trend rally into a prior supply block / zone, showing hesitation and rejection. (we are likely done, since it had retraced to 0.5 Fib of Wave 3), i am not ruling out where we may have one more small wave up before we get into the real wave (5).
Wave (5) — Still developing, assuming wave (4) is done, we are likely to push into the lower yellow demand zone, where either continuation or a significant rebound may occur.
One scenario that can happen is that we double bottom where wave 5 meet end of wave 3, and we start a corrective wave up which is a potential Wave B going up.
🟧 Key Levels to Watch
Upper Zone (around 4271–4290)
This zone aligns with the ORH level and prior Wave (4) rejection area.
➝ If broken with strong momentum, it can invalidate the immediate bearish Wave 5 scenario and hint at a deeper retracement or new bullish structure.
Lower Zone (around 4198–4181)
This is a strong demand zone, confluence with Wave (3) extension targets and potential end of Wave (5).
➝ Price reaction here is crucial: either we see a clean 5-wave completion and rebound, or further downside acceleration.
📊 Momentum Confirmation (MACD)
The MACD shows a decelerating bearish momentum going into Wave (5), which fits the classic pattern where Wave 3 has the strongest momentum and Wave 5 often shows divergence or a weaker push.
If MACD prints a higher low while price makes a lower low, that would confirm bullish divergence, a common reversal signal after an impulse.
📝 Trading Implications
Scenario A — Bounce at Demand Zone:
Look for reversal signals or bullish divergence near 4180–4198 to confirm the end of Wave (5). Potential short-covering rally could take us close to 4300
Scenario B — Breakdown Below Demand Zone:
A clean break and close below 4180 may open the door to extended bearish continuation — likely a larger degree correction or Wave C structure.
Invalidation:
A move and acceptance above the upper ORH zone would invalidate this short-term bearish count.
Final Thoughts
This setup is technically clean:
Clear Elliott structure
Key liquidity zones mapped
Momentum oscillator in sync with price action
⚠️ But remember, Wave 5s can truncate or extend, so flexibility is key. Watch how price behaves at the lower yellow zone — that’s where the next big move could be born.
Wave Structure Overview
The current structure on the 15-minute chart appears to be unfolding in a classic 5-wave impulsive sequence:
Wave (1) — Initial sell-off following local top formation.
Wave (2) — Sharp retracement, testing previous supply, rejected at previous premarket range high (Friday US Stocks premarket high)
Wave (3) — Strong impulsive move down with expanding volume, typical of a wave 3 extension.
It respected one of our previous opening range high (lower yellow level).
Wave (4) — Counter-trend rally into a prior supply block / zone, showing hesitation and rejection. (we are likely done, since it had retraced to 0.5 Fib of Wave 3), i am not ruling out where we may have one more small wave up before we get into the real wave (5).
Wave (5) — Still developing, assuming wave (4) is done, we are likely to push into the lower yellow demand zone, where either continuation or a significant rebound may occur.
One scenario that can happen is that we double bottom where wave 5 meet end of wave 3, and we start a corrective wave up which is a potential Wave B going up.
🟧 Key Levels to Watch
Upper Zone (around 4271–4290)
This zone aligns with the ORH level and prior Wave (4) rejection area.
➝ If broken with strong momentum, it can invalidate the immediate bearish Wave 5 scenario and hint at a deeper retracement or new bullish structure.
Lower Zone (around 4198–4181)
This is a strong demand zone, confluence with Wave (3) extension targets and potential end of Wave (5).
➝ Price reaction here is crucial: either we see a clean 5-wave completion and rebound, or further downside acceleration.
📊 Momentum Confirmation (MACD)
The MACD shows a decelerating bearish momentum going into Wave (5), which fits the classic pattern where Wave 3 has the strongest momentum and Wave 5 often shows divergence or a weaker push.
If MACD prints a higher low while price makes a lower low, that would confirm bullish divergence, a common reversal signal after an impulse.
📝 Trading Implications
Scenario A — Bounce at Demand Zone:
Look for reversal signals or bullish divergence near 4180–4198 to confirm the end of Wave (5). Potential short-covering rally could take us close to 4300
Scenario B — Breakdown Below Demand Zone:
A clean break and close below 4180 may open the door to extended bearish continuation — likely a larger degree correction or Wave C structure.
Invalidation:
A move and acceptance above the upper ORH zone would invalidate this short-term bearish count.
Final Thoughts
This setup is technically clean:
Clear Elliott structure
Key liquidity zones mapped
Momentum oscillator in sync with price action
⚠️ But remember, Wave 5s can truncate or extend, so flexibility is key. Watch how price behaves at the lower yellow zone — that’s where the next big move could be born.
إخلاء المسؤولية
لا يُقصد بالمعلومات والمنشورات أن تكون، أو تشكل، أي نصيحة مالية أو استثمارية أو تجارية أو أنواع أخرى من النصائح أو التوصيات المقدمة أو المعتمدة من TradingView. اقرأ المزيد في شروط الاستخدام.
إخلاء المسؤولية
لا يُقصد بالمعلومات والمنشورات أن تكون، أو تشكل، أي نصيحة مالية أو استثمارية أو تجارية أو أنواع أخرى من النصائح أو التوصيات المقدمة أو المعتمدة من TradingView. اقرأ المزيد في شروط الاستخدام.