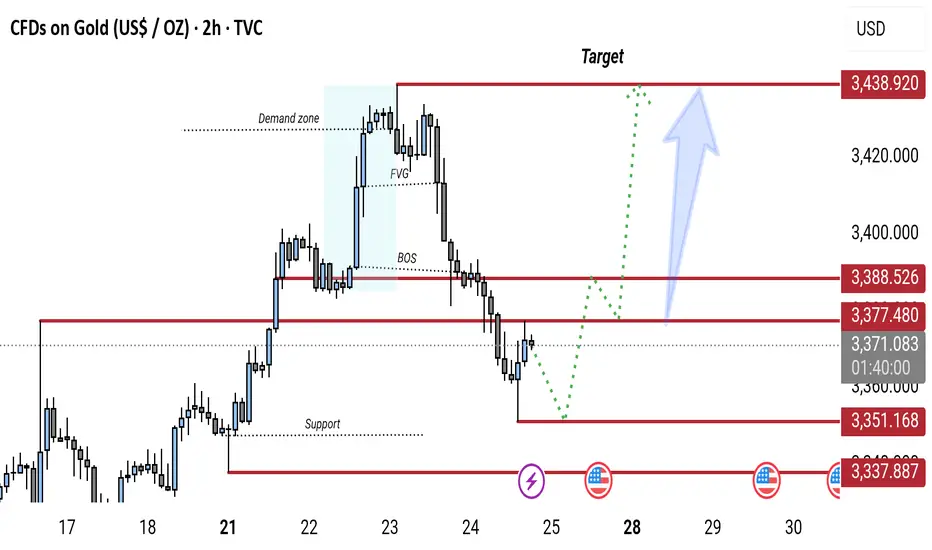
Gold (XAU/USD) 2H chart shows a bearish break of structure (BOS) followed by a pullback toward a key support zone (around 3,337–3,351). A potential bullish reversal is expected from this zone, targeting the 3,438 resistance level. The chart highlights a demand zone, FVG (Fair Value Gap), and possible retracement before continuation to the upside.
إخلاء المسؤولية
لا يُقصد بالمعلومات والمنشورات أن تكون، أو تشكل، أي نصيحة مالية أو استثمارية أو تجارية أو أنواع أخرى من النصائح أو التوصيات المقدمة أو المعتمدة من TradingView. اقرأ المزيد في شروط الاستخدام.
إخلاء المسؤولية
لا يُقصد بالمعلومات والمنشورات أن تكون، أو تشكل، أي نصيحة مالية أو استثمارية أو تجارية أو أنواع أخرى من النصائح أو التوصيات المقدمة أو المعتمدة من TradingView. اقرأ المزيد في شروط الاستخدام.