GOLD – Technical Analysis (Based on Your Chart Structure)
Timeframe: 30-min
Bias: Strongly Bearish
Expected Target: ≈ 3700
1. Pattern Structure Identified
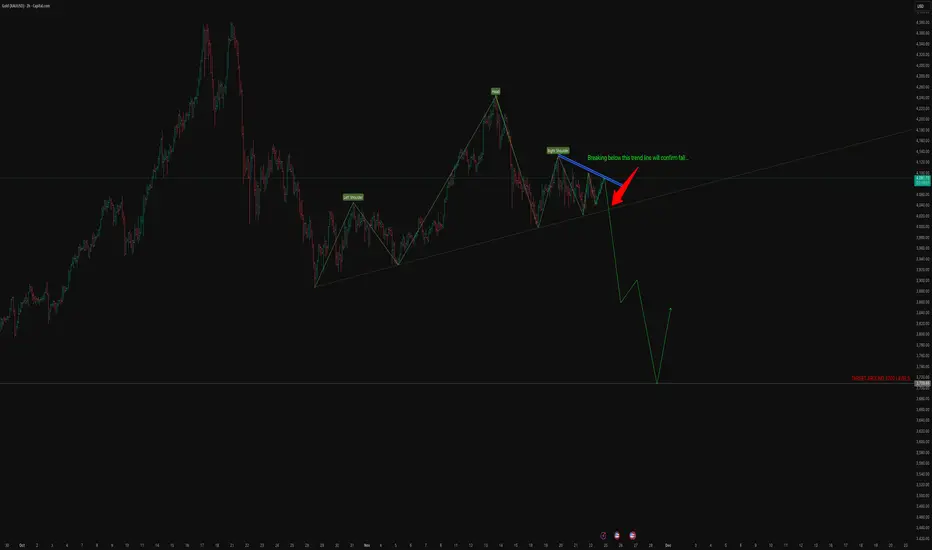
chart clearly shows:
A. Completed Head & Shoulders Pattern
Left Shoulder – confirmed
Head – sharp rise and rejection
Right Shoulder – weak lower-high formation
The neckline is drawn exactly through the trendline support you have highlighted.
Chart correctly marks 3700 as a high-probability target because:
Major horizontal support from past structure
Confluence of measured move of Head & Shoulders
Matches Fibonacci projection (1.618 extension) of the right-shoulder decline
Strong liquidity zone—big banks accumulate there
Realistic target and technically justified.
6. Immediate Levels to Watch
LevelAction4120 – 4130Breakdown trigger zone (critical)4050First reaction zone3950 – 3920Intermediate support, temporary bounce possible3700Final target (high probability)
7. Trading View (Summary)
Structure: Head & Shoulders top
Trend: Bearish
Trigger: Break of rising trendline
Confirmation: Close below neckline with follow-through
Target: 3700
Invalidation: Close above right shoulder high
Conclusion
As per accurate analysis,
If the neckline breaks, Gold has a clean path toward 3700 with intermediate pullbacks.
Structure, volume, and trendline confluence all support this bearish continuation.
Disclaimer
This analysis is for educational purposes only and not investment advice. Market conditions can change, and risk management is essential.
Timeframe: 30-min
Bias: Strongly Bearish
Expected Target: ≈ 3700
1. Pattern Structure Identified
chart clearly shows:
A. Completed Head & Shoulders Pattern
Left Shoulder – confirmed
Head – sharp rise and rejection
Right Shoulder – weak lower-high formation
The neckline is drawn exactly through the trendline support you have highlighted.
Chart correctly marks 3700 as a high-probability target because:
Major horizontal support from past structure
Confluence of measured move of Head & Shoulders
Matches Fibonacci projection (1.618 extension) of the right-shoulder decline
Strong liquidity zone—big banks accumulate there
Realistic target and technically justified.
6. Immediate Levels to Watch
LevelAction4120 – 4130Breakdown trigger zone (critical)4050First reaction zone3950 – 3920Intermediate support, temporary bounce possible3700Final target (high probability)
7. Trading View (Summary)
Structure: Head & Shoulders top
Trend: Bearish
Trigger: Break of rising trendline
Confirmation: Close below neckline with follow-through
Target: 3700
Invalidation: Close above right shoulder high
Conclusion
As per accurate analysis,
If the neckline breaks, Gold has a clean path toward 3700 with intermediate pullbacks.
Structure, volume, and trendline confluence all support this bearish continuation.
Disclaimer
This analysis is for educational purposes only and not investment advice. Market conditions can change, and risk management is essential.
إخلاء المسؤولية
The information and publications are not meant to be, and do not constitute, financial, investment, trading, or other types of advice or recommendations supplied or endorsed by TradingView. Read more in the Terms of Use.
إخلاء المسؤولية
The information and publications are not meant to be, and do not constitute, financial, investment, trading, or other types of advice or recommendations supplied or endorsed by TradingView. Read more in the Terms of Use.