Having surged through key resistance earlier this month, gold has firmly reasserted its uptrend. Let’s take a look at what’s driving the move and where the next opportunities may lie.
Politics, policy and the perfect storm
The latest leg higher has been powered by a potent mix of politics and policy. Softer US jobs data has markets fully pricing a rate cut at this Wednesday’s Federal Reserve meeting, with some even calling for a larger move. At the same time Donald Trump’s attacks on the Fed have unsettled confidence in central bank independence. That combination has left the dollar vulnerable and reinforced gold’s appeal as a safe store of value.
Debt and inflation worries are adding another layer of support. Real yields look set to dip negative again, a backdrop in which gold has historically thrived. Concerns over the US fiscal outlook and the risk of stagflation under Trump’s tariff agenda have only intensified the demand for hedges. Meanwhile conviction buyers such as central banks, ETFs and macro funds continue to add to positions, underlining the strength behind this rally.
A breakout with fuel in the tank
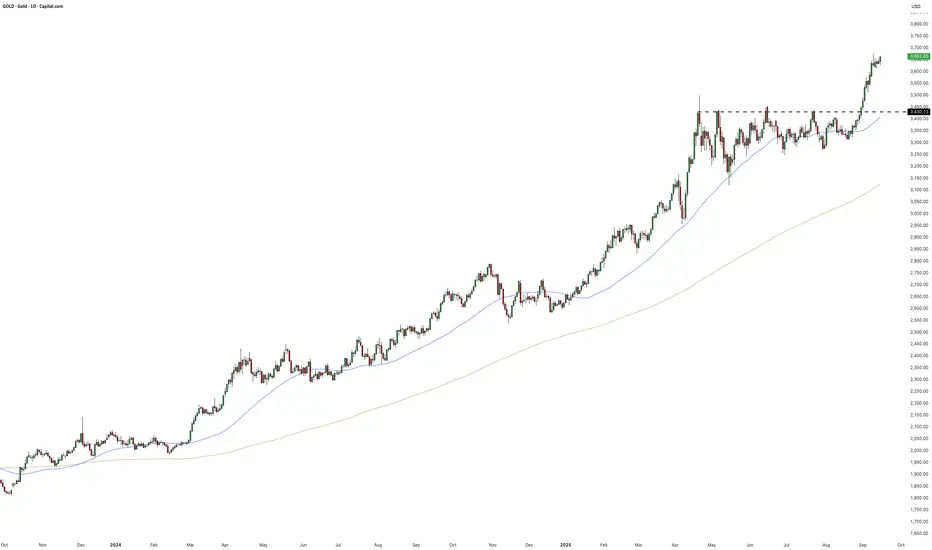
On the daily timeframe the breakout is clear. After months of congestion, gold blasted through resistance and is now consolidating its gains. The next phase will depend on how price behaves around the support zones that have formed below. The first sits around the flip zone where broken resistance has become support and neatly aligns with the VWAP anchored to the pre breakout lows. A second pocket of liquidity lies just beneath at the base of the old resistance band, which is also in confluence with the 50 day moving average.
Gold Daily Candle Chart

Past performance is not a reliable indicator of future results
Zooming into the hourly chart adds further context. Last week’s surge has settled into a tight trading range. Momentum remains with the bulls, which means another push higher before a deeper pullback is entirely possible. This kind of consolidation is often a healthy pause after a breakout, allowing the market to reset before the next leg.
Should the range break lower, those daily support zones are where buyers will be expected to step back in. That would keep the breakout structure intact and provide tactical opportunities for dip buyers to reload. The path of least resistance is still higher, but the market may want to test how deep support runs before driving further into record territory.
Gold Hourly Candle Chart

Past performance is not a reliable indicator of future results
Disclaimer: This is for information and learning purposes only. The information provided does not constitute investment advice nor take into account the individual financial circumstances or objectives of any investor. Any information that may be provided relating to past performance is not a reliable indicator of future results or performance. Social media channels are not relevant for UK residents.
Spread bets and CFDs are complex instruments and come with a high risk of losing money rapidly due to leverage. 85.24% of retail investor accounts lose money when trading spread bets and CFDs with this provider. You should consider whether you understand how spread bets and CFDs work and whether you can afford to take the high risk of losing your money.
Politics, policy and the perfect storm
The latest leg higher has been powered by a potent mix of politics and policy. Softer US jobs data has markets fully pricing a rate cut at this Wednesday’s Federal Reserve meeting, with some even calling for a larger move. At the same time Donald Trump’s attacks on the Fed have unsettled confidence in central bank independence. That combination has left the dollar vulnerable and reinforced gold’s appeal as a safe store of value.
Debt and inflation worries are adding another layer of support. Real yields look set to dip negative again, a backdrop in which gold has historically thrived. Concerns over the US fiscal outlook and the risk of stagflation under Trump’s tariff agenda have only intensified the demand for hedges. Meanwhile conviction buyers such as central banks, ETFs and macro funds continue to add to positions, underlining the strength behind this rally.
A breakout with fuel in the tank
On the daily timeframe the breakout is clear. After months of congestion, gold blasted through resistance and is now consolidating its gains. The next phase will depend on how price behaves around the support zones that have formed below. The first sits around the flip zone where broken resistance has become support and neatly aligns with the VWAP anchored to the pre breakout lows. A second pocket of liquidity lies just beneath at the base of the old resistance band, which is also in confluence with the 50 day moving average.
Gold Daily Candle Chart
Past performance is not a reliable indicator of future results
Zooming into the hourly chart adds further context. Last week’s surge has settled into a tight trading range. Momentum remains with the bulls, which means another push higher before a deeper pullback is entirely possible. This kind of consolidation is often a healthy pause after a breakout, allowing the market to reset before the next leg.
Should the range break lower, those daily support zones are where buyers will be expected to step back in. That would keep the breakout structure intact and provide tactical opportunities for dip buyers to reload. The path of least resistance is still higher, but the market may want to test how deep support runs before driving further into record territory.
Gold Hourly Candle Chart
Past performance is not a reliable indicator of future results
Disclaimer: This is for information and learning purposes only. The information provided does not constitute investment advice nor take into account the individual financial circumstances or objectives of any investor. Any information that may be provided relating to past performance is not a reliable indicator of future results or performance. Social media channels are not relevant for UK residents.
Spread bets and CFDs are complex instruments and come with a high risk of losing money rapidly due to leverage. 85.24% of retail investor accounts lose money when trading spread bets and CFDs with this provider. You should consider whether you understand how spread bets and CFDs work and whether you can afford to take the high risk of losing your money.
إخلاء المسؤولية
لا يُقصد بالمعلومات والمنشورات أن تكون، أو تشكل، أي نصيحة مالية أو استثمارية أو تجارية أو أنواع أخرى من النصائح أو التوصيات المقدمة أو المعتمدة من TradingView. اقرأ المزيد في شروط الاستخدام.
إخلاء المسؤولية
لا يُقصد بالمعلومات والمنشورات أن تكون، أو تشكل، أي نصيحة مالية أو استثمارية أو تجارية أو أنواع أخرى من النصائح أو التوصيات المقدمة أو المعتمدة من TradingView. اقرأ المزيد في شروط الاستخدام.