XAU/USD Chart Analysis (H1 timeframe)
Here’s the English version of the breakdown:
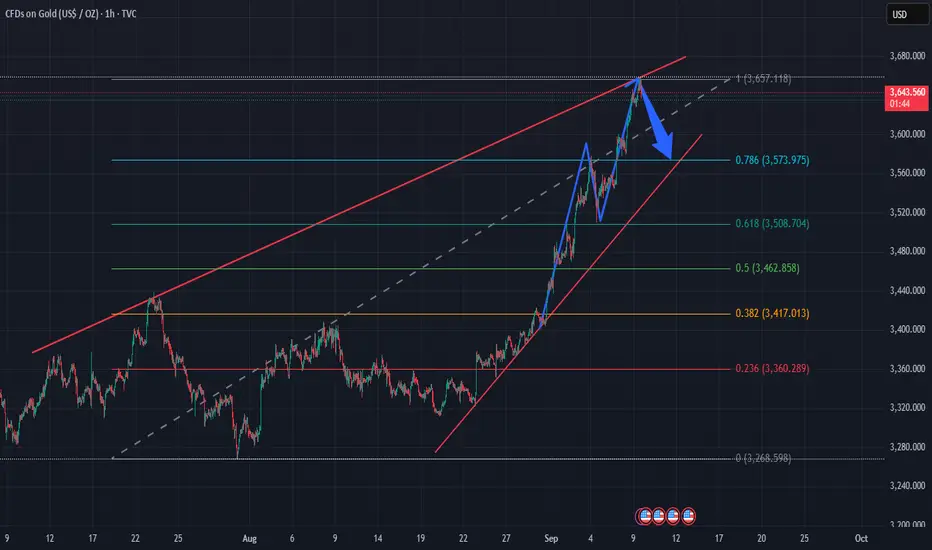
1. Main Trend
Gold has been in a strong uptrend, moving from the 3,330 → 3,660 USD zone.
The red trendlines form a steep ascending channel.
However, around the 3,660 resistance level, price shows signs of stalling.
2. Chart Pattern
A Rising Wedge pattern can be identified.
This is typically a bearish reversal signal once price breaks below the lower trendline.
The blue arrows highlight a potential move: strong push up → rejection → pullback to retest support.
3. Fibonacci Retracement
Key retracement levels:
0.236 ≈ 3,360
0.382 ≈ 3,420
0.5 ≈ 3,480
0.618 ≈ 3,520
0.786 ≈ 3,560
Currently, price is testing the 0.786 zone (3,560–3,580). A break lower could trigger a deeper correction.
4. Short-Term Scenarios
Scenario 1 (preferred): Price rejects the 3,660 resistance → correction toward 3,560 → 3,520 → 3,480.
Scenario 2 (less likely): If price breaks above 3,660 with strong volume, it may extend toward 3,700.
5. Trading Strategy (for reference)
Short entries: 3,640–3,660
Stop Loss: above 3,680
Take Profit: 3,560 → 3,520 → 3,480
Long entries: Only if price sustains above the trendline and breaks 3,660 with strong bullish momentum.
👉 Summary: Gold is facing heavy resistance at 3,660. The broader trend is still bullish, but short-term signals suggest a potential pullback toward the 0.618–0.5 Fibonacci zones (3,520–3,480).
Here’s the English version of the breakdown:
1. Main Trend
Gold has been in a strong uptrend, moving from the 3,330 → 3,660 USD zone.
The red trendlines form a steep ascending channel.
However, around the 3,660 resistance level, price shows signs of stalling.
2. Chart Pattern
A Rising Wedge pattern can be identified.
This is typically a bearish reversal signal once price breaks below the lower trendline.
The blue arrows highlight a potential move: strong push up → rejection → pullback to retest support.
3. Fibonacci Retracement
Key retracement levels:
0.236 ≈ 3,360
0.382 ≈ 3,420
0.5 ≈ 3,480
0.618 ≈ 3,520
0.786 ≈ 3,560
Currently, price is testing the 0.786 zone (3,560–3,580). A break lower could trigger a deeper correction.
4. Short-Term Scenarios
Scenario 1 (preferred): Price rejects the 3,660 resistance → correction toward 3,560 → 3,520 → 3,480.
Scenario 2 (less likely): If price breaks above 3,660 with strong volume, it may extend toward 3,700.
5. Trading Strategy (for reference)
Short entries: 3,640–3,660
Stop Loss: above 3,680
Take Profit: 3,560 → 3,520 → 3,480
Long entries: Only if price sustains above the trendline and breaks 3,660 with strong bullish momentum.
👉 Summary: Gold is facing heavy resistance at 3,660. The broader trend is still bullish, but short-term signals suggest a potential pullback toward the 0.618–0.5 Fibonacci zones (3,520–3,480).
✅MY FREE FOREX & XAUUSD SIGNALS TELEGRAM CHANNEL:
t.me/JENDAFISH
🔴9-12 signals per day
🔴Free knowledge support
🔴24/7 support for newbies.
🔴You always have priority.
JENDA FISH 😘
t.me/JENDAFISH
🔴9-12 signals per day
🔴Free knowledge support
🔴24/7 support for newbies.
🔴You always have priority.
JENDA FISH 😘
منشورات ذات صلة
إخلاء المسؤولية
لا يُقصد بالمعلومات والمنشورات أن تكون، أو تشكل، أي نصيحة مالية أو استثمارية أو تجارية أو أنواع أخرى من النصائح أو التوصيات المقدمة أو المعتمدة من TradingView. اقرأ المزيد في شروط الاستخدام.