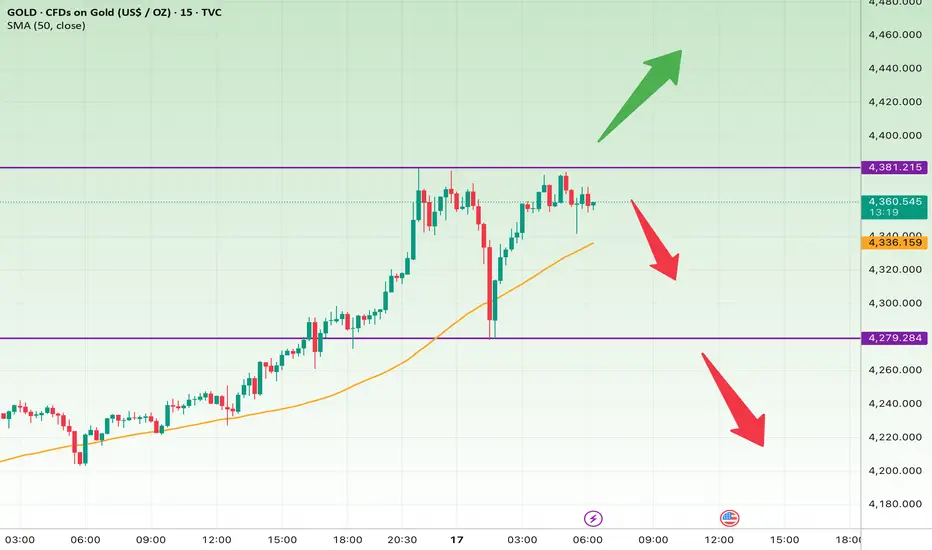
On the 15-minute gold chart, price is testing the key resistance around $4,381. This level has acted as a ceiling several times, suggesting strong selling pressure. The 50-period SMA at $4,234 still supports the broader uptrend, but momentum appears to be weakening near resistance.
In the short term, a close below $4,340 could trigger a pullback toward $4,280 and possibly $4,240. A reasonable stop loss for this scenario is above $4,385.
In the longer-term view (over the next few sessions), if gold breaks and sustains above $4,381, we could see an upside move toward $4,400 and $4,460. The protective stop for this bullish setup should be below $4,275.
Overall, gold is at a decision point — a breakout could signal continuation of the bullish wave, while rejection from resistance may lead to a short-term correction.
إخلاء المسؤولية
لا يُقصد بالمعلومات والمنشورات أن تكون، أو تشكل، أي نصيحة مالية أو استثمارية أو تجارية أو أنواع أخرى من النصائح أو التوصيات المقدمة أو المعتمدة من TradingView. اقرأ المزيد في شروط الاستخدام.
إخلاء المسؤولية
لا يُقصد بالمعلومات والمنشورات أن تكون، أو تشكل، أي نصيحة مالية أو استثمارية أو تجارية أو أنواع أخرى من النصائح أو التوصيات المقدمة أو المعتمدة من TradingView. اقرأ المزيد في شروط الاستخدام.