📈 Gold Technical Analysis (1h Chart)
The chart shows a distinct price pattern and a potential trading setup following a significant rally.
Key Observations
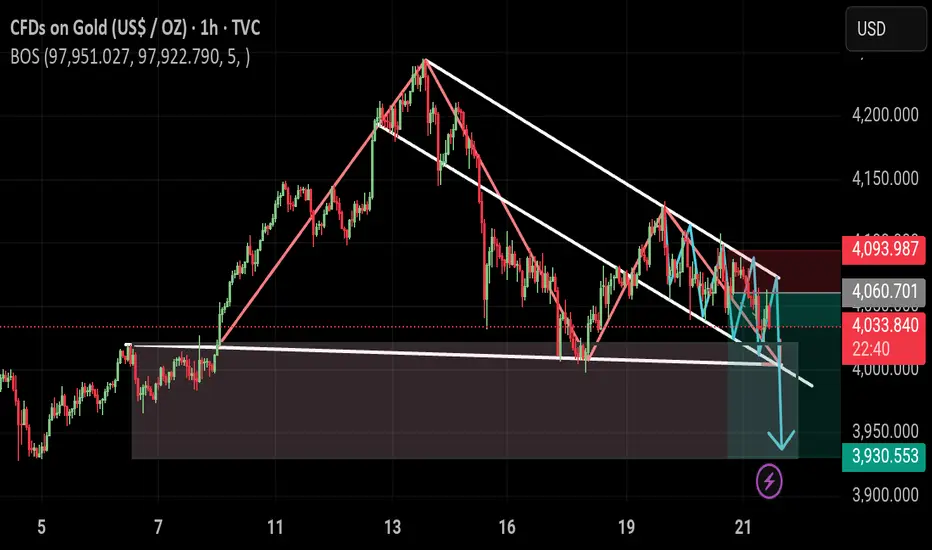
Prior Movement: The price made a sharp upward move, peaking around $4,200 (on November 13th), followed by a clear downtrend.
Correction/Pattern: Since the peak, the price action has formed a Descending Channel (or potential Bear Flag) indicated by the two parallel white trendlines. This suggests a corrective phase after the initial rally.
Support Zone: There is a significant Horizontal Support Zone highlighted by the shaded brown rectangle, roughly between $3,950 and $4,000, which corresponds to a previous area of consolidation/resistance (around November 7th-9th) that was broken to the upside. The price has recently tested the upper boundary of this zone.
Recent Action: The price is currently near the lower boundary of the descending channel and appears to be testing both the channel support and the upper boundary of the horizontal support zone.
Trading Setup
The chart features an active Short (Sell) setup, indicating a bearish bias:
Entry Price: $4,060.701 (The price is currently $4,035.592, suggesting the entry was taken earlier or the current price is the market price).
Stop Loss (Red Area): Set at $4,093.987. This is placed just above the recent swing high within the descending channel, protecting against a bullish breakout.
Take Profit (Green/Teal Area): Set at $3,930.553. This target aims for a move that breaks below the horizontal support zone and potentially reaches the prior consolidation lows.
Risk/Reward Ratio: The size of the red box (risk) versus the size of the teal box (reward) suggests a favorable risk/reward ratio for this trade.
Conclusion
The overall pattern suggests that Gold is undergoing a healthy correction within a descending channel. The active trade is betting on a breakout below the channel and the key horizontal support zone ($3,950 - $4,000) to confirm a deeper correction. If the price fails to break lower and instead breaks above the descending channel, the short position would be stopped out, potentially signaling a continuation of the prior uptrend.
Would you like a summary of the next most likely price movements based on this pattern?
أغلقت الصفقة: تم الوصول لوقف الخسارة
Free Forex signals & Daily updates 💹
t.me/+D1falYavqJAxMzE0
For any assistance contact us 🤓
t.me/Travis_816
Join Us Today On Telegram 👆👆
t.me/+D1falYavqJAxMzE0
For any assistance contact us 🤓
t.me/Travis_816
Join Us Today On Telegram 👆👆
إخلاء المسؤولية
The information and publications are not meant to be, and do not constitute, financial, investment, trading, or other types of advice or recommendations supplied or endorsed by TradingView. Read more in the Terms of Use.