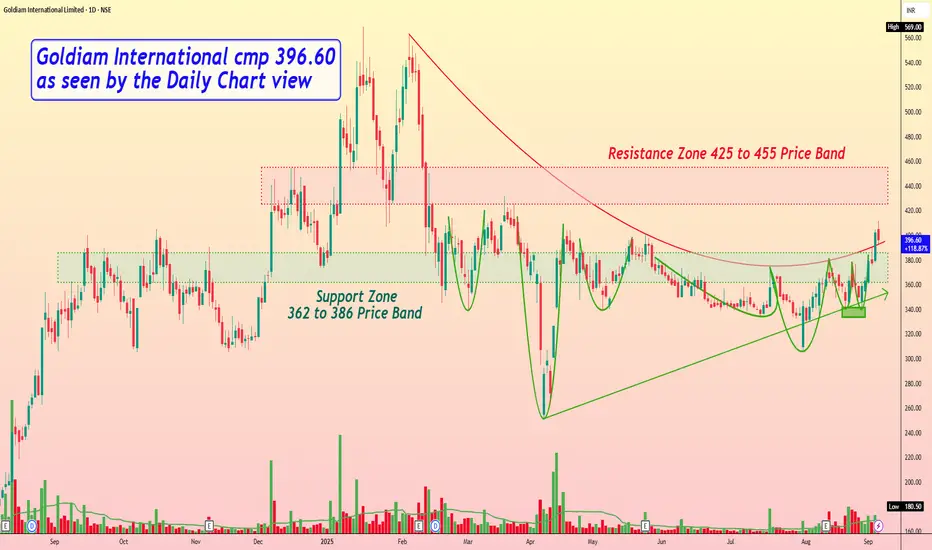
Goldiam International cmp 396.60 as seen by the Daily Chart view
- Support Zone 362 to 386 Price Band
- Resistance Zone 425 to 455 Price Band
- Bullish "W" with Double Bottom formed at 340 price level
- Breakout attempted from Curved Falling Resistance Trendline
- Price momentum has well respected the Rising Support Trendline
- Volumes spiking above avg traded quantity over the past few weeks
- Multiple Bullish Rounding Bottoms formed around Support Zone neckline
- Majority of common Technical Indicator BB, EMA, MACD, RSI trending positively
إخلاء المسؤولية
لا يُقصد بالمعلومات والمنشورات أن تكون، أو تشكل، أي نصيحة مالية أو استثمارية أو تجارية أو أنواع أخرى من النصائح أو التوصيات المقدمة أو المعتمدة من TradingView. اقرأ المزيد في شروط الاستخدام.
إخلاء المسؤولية
لا يُقصد بالمعلومات والمنشورات أن تكون، أو تشكل، أي نصيحة مالية أو استثمارية أو تجارية أو أنواع أخرى من النصائح أو التوصيات المقدمة أو المعتمدة من TradingView. اقرأ المزيد في شروط الاستخدام.