شراء
Gold (Dec 2025) – Target colpito e segni di inversione
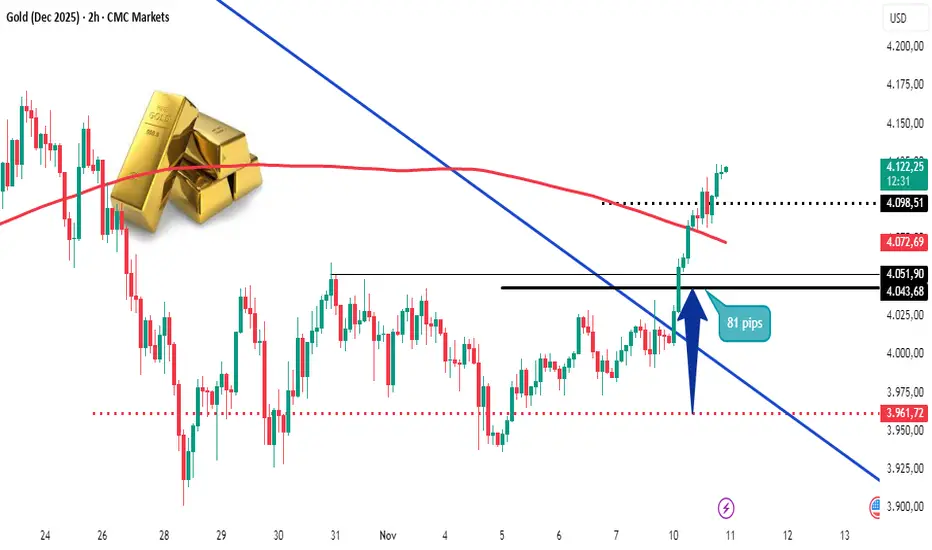
Come anticipato nell’analisi pubblicata l’8 novembre, il quadro tecnico dell’oro stava disegnando una chiara possibilità di movimento contro trend, con ingresso in area 3.961,72 USD e target a 4.043,68 USD.
L’operazione, portata a termine con un bottino di 81 pips, non solo ha centrato il livello chiave previsto, ma ha proseguito la corsa fino a toccare la soglia di 4.098,51 USD, individuata ora come tetto massimo del trend momentaneo.
Il prezzo ha mostrato una rottura pulita della trendline discendente e un successivo consolidamento sopra la media mobile principale, confermando una fase di forza a breve termine.
Questa dinamica è tipica delle fasi di reversal tecnico, in cui la pressione in acquisto cresce dopo una lunga fase di accumulazione.
📊 Livelli tecnici principali:
* Ingresso: 3.961,72 USD
* Target primario: 4.043,68 USD ✅
* Estensione massima raggiunta: 4.098,51 USD
* Supporto dinamico di breve: 4.072,68 USD
🎯 Cosa imparare da questa analisi – I segni di inversione
Riconoscere un’inversione non significa “indovinare il minimo”, ma intercettare i segnali che anticipano un cambio di equilibrio tra domanda e offerta.
Nel caso dell’oro, alcuni elementi chiave erano già visibili:
1. Rottura della trendline ribassista → primo segnale che la pressione in vendita stava cedendo.
2. Incremento dei volumi nelle ultime barre prima della rottura → conferma che i compratori stavano entrando sul mercato.
3. Chiusure sopra la media mobile a 200 periodi → elemento di forza che consolida la ripresa del momentum.
4. Pullback controllato dopo il breakout → segnale di fiducia da parte degli operatori istituzionali.
👉 La lezione di oggi è chiara: un’inversione non si anticipa, si osserva e si conferma graficamente.
Solo quando i segnali tecnici si allineano, la probabilità di successo diventa statisticamente favorevole.
📈 Gold (Dec 2025) – Target Hit and Clear Signs of Reversal
As anticipated in my November 8th post, the technical setup on Gold (Dec 2025) was showing a potential counter-trend opportunity, with an entry at 3,961.72 USD and a projected target of 4,043.68 USD.
The trade played out perfectly, delivering a solid +81 pips, and even extended higher to 4,098.51 USD, which I now consider the temporary ceiling of the current move.
The breakout above the descending trendline and the 200-period moving average confirmed a short-term shift in market sentiment — a textbook example of how reversals often begin.
This move also showed strong volume confirmation, which reinforced the breakout’s validity and indicated institutional participation.
📊 Key Technical Levels:
* Entry: 3,961.72 USD
* Primary Target: 4,043.68 USD ✅
* Max Extension: 4,098.51 USD
* Dynamic Support: 4,072.68 USD
---
🎯 Key Takeaway – Understanding Reversal Signals
Spotting a reversal doesn’t mean trying to catch the bottom — it means identifying the moment when balance shifts between buyers and sellers.
Here’s what made this setup so significant:
1. Breakout of the descending trendline → early signal of weakening selling pressure.
2. Rising volume before and during breakout → evidence of institutional buying.
3. Price closing above the 200 MA → clear confirmation of short-term strength.
4. Controlled pullback after breakout → validation of trend change, not just a spike.
👉 The real lesson: Reversals are not predictions — they are confirmations.
When technical signals align, probability starts to work in your favor.
#gold #analisiTecnica #tradingview #pattern #priceaction #forex #commodities #trendanalysis #tradingeducation #investireingiustizia #traderitalia #mercatioro
إخلاء المسؤولية
لا يُقصد بالمعلومات والمنشورات أن تكون، أو تشكل، أي نصيحة مالية أو استثمارية أو تجارية أو أنواع أخرى من النصائح أو التوصيات المقدمة أو المعتمدة من TradingView. اقرأ المزيد في شروط الاستخدام.
إخلاء المسؤولية
لا يُقصد بالمعلومات والمنشورات أن تكون، أو تشكل، أي نصيحة مالية أو استثمارية أو تجارية أو أنواع أخرى من النصائح أو التوصيات المقدمة أو المعتمدة من TradingView. اقرأ المزيد في شروط الاستخدام.