It's been exactly 2 months (September 05, see chart below) when we last had a look at Google (GOOG) giving a strong break-out Buy Signal that methodically hit our $275 Target:

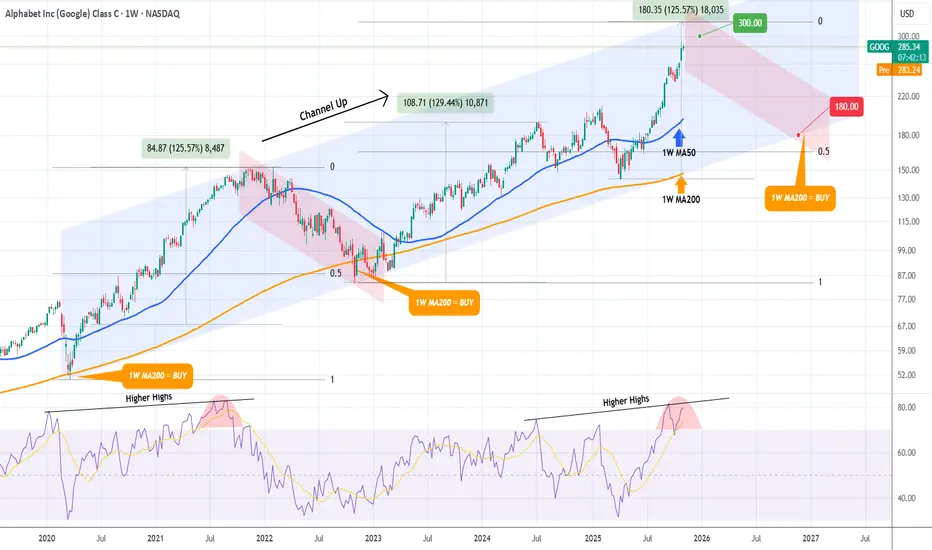
This time we look at the stock from a much longer term perspective on the 1W time-frame, where it is approaching the top (Higher Highs trend-line) of the Channel Up that started on the COVID crash (March 2020).
This is a major Sell Alert as the 1W RSI is also printing a Double Top formation similar to the November 15 2021 Top. Given that +125% rallies have been the most common long-term sequences of this pattern, we believe that any price above $300 is a major Sell for Google.
The strongest long-term Support and Target of correction sequences/ Bearish Legs has been the 1W MA200 (orange trend-line) and this is our Target for 2026. We estimate that a potential contact with the 1W MA200 can be made at around $180 (also marginally above the 0.5 Fibonacci level from the bottom of the previous correction). A contact with the 1W MA200 will be our next long-term Buy on Google.
-------------------------------------------------------------------------------
** Please LIKE 👍, FOLLOW ✅, SHARE 🙌 and COMMENT ✍ if you enjoy this idea! Also share your ideas and charts in the comments section below! This is best way to keep it relevant, support us, keep the content here free and allow the idea to reach as many people as possible. **
-------------------------------------------------------------------------------
💸💸💸💸💸💸
👇 👇 👇 👇 👇 👇
👑Best Signals (Forex/Crypto+70% accuracy) & Account Management (+20% profit/month on 10k accounts)
💰Free Channel t.me/tradingshotglobal
🤵Contact info@tradingshot.com t.me/tradingshot
🔥New service: next X100 crypto GEMS!
💰Free Channel t.me/tradingshotglobal
🤵Contact info@tradingshot.com t.me/tradingshot
🔥New service: next X100 crypto GEMS!
إخلاء المسؤولية
لا يُقصد بالمعلومات والمنشورات أن تكون، أو تشكل، أي نصيحة مالية أو استثمارية أو تجارية أو أنواع أخرى من النصائح أو التوصيات المقدمة أو المعتمدة من TradingView. اقرأ المزيد في شروط الاستخدام.