GOOGL Momentum Wave at Peak Extension – Liquidity Battle Ahead🔥
WEEKLY TIMEFRAME ANALYSIS
1. Market Structure
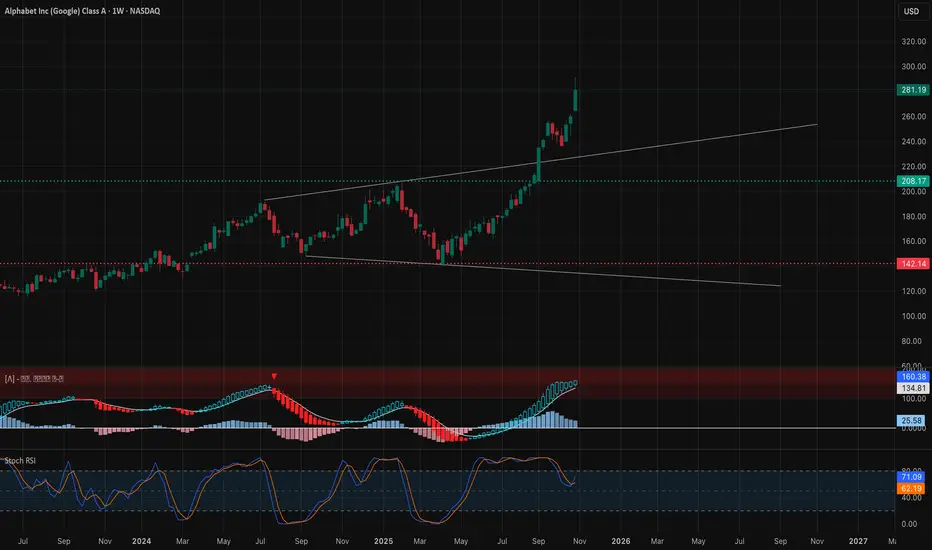
GOOGL remains in a dominant weekly uptrend with a clean BOS breakout over previous highs. The chart printed a shallow pullback that respected the mid-trendline before pushing higher — that’s characteristic of momentum-driven accumulation.
We saw previous CHoCH attempts during earnings volatility, but none sustained. That tells me smart money absorbed dips instead of distributing.
Major liquidity sits below: • $207–$210 • $186–$190
Above current price is discovery — thin liquidity, fast travel potential.
2. Supply & Demand / Order Blocks
There’s a bullish order block sitting right around $207–$210 that hasn’t been fully mitigated. If the market wants a discount, that’s the obvious landing spot.
Deeper demand lives at $140–$156, serving as the long-term institutional accumulation range.
Supply overhead begins in the $290–$300 band. That’s where short sellers tend to get aggressive and profit-takers defend levels.
3. Indicator Confluence
The 9EMA above 21EMA with strong slope confirms trend continuation. MACD histogram is showing large green bars — buyers still have authority. Stoch RSI is elevated but cycling with price, not diverging.
Volume expansion during push candles suggests trend confirmation, not exhaustion… yet.
4. Weekly Tone
Momentum is stretched, but dips continue to get bought. If the market pulls back into the mid-trendline, that will be a high-confluence area for continuation traders.
DAILY TIMEFRAME ANALYSIS

1. Market Structure
Daily candles show an extended channel grind higher. Friday printed a pullback wick from upper channel resistance — exactly where you’d expect algo sell programs to fire.
Key structure levels: • $256 support (micro trendline convergence) • $235 for deeper liquidity sweeps
A breakdown below $256 would telegraph distribution before continuation.
2. Supply & Demand / Order Blocks
Demand clusters: • $256–$258 (first bounce zone) • $235–$238 (secondary re-load if volatility spikes)
Supply clusters: • $281–$286 (multiple rejections) • $298–$300 psychological wall
Breaking $286 with volume opens the window to run trapped shorts quickly.
3. Indicator Confluence
The 9EMA is still above the 21EMA, but slope is flattening — early caution sign. MACD histogram is stabilizing after a strong push. Stoch RSI remains high but hasn’t crossed down yet — bulls still in control.
Volume is softening; expect mean reversion behavior early week.
4. Daily Tone
As long as GOOGL respects the mid-channel, dips are buyable. Lose the channel and we’ll rotate into liquidity pockets below $260.
15-MINUTE INTRADAY STRUCTURE

1. Market Structure
The 15m printed a CHoCH → BOS sequence after liquidity was swept at $277.04. Price then consolidated in a wedge under micro resistance — typical pre-break setup.
However, lack of continuation into close suggests market makers are waiting until liquidity opens Monday.
2. Supply & Demand / Order Blocks
Demand intraday: • $278.20–$279.20 (first bounce pocket) • $277.00–$277.50 (deeper wicks)
Supply intraday: • $283.00–$286.05 (active sell wall) • $289.50 liquidity shelf on upside rejection
Breakout above $283 will trap short scalpers.
3. Indicator Confluence
9EMA curling toward 21EMA, signaling potential early session squeeze. MACD histogram is flattening — momentum coiling. Stoch RSI is curling up from lower band — bullish inflection signal.
4. Intraday Tone
Expect fakeout volatility first 30 minutes. If micro trendline breaks with volume confirmation, watch for a push into $283+, possibly wicking into $286.
GEX (Gamma Exposure) & OPTIONS SENTIMENT

Call walls stack at: • $297.5 • $300 Strong gamma magnets if price enters that zone.
The highest positive NET GEX sits around $280.75 — this is why price keeps orbiting here. Dealers hedge around this level to reduce risk.
Put support sits at: • $275 • $265
Break below $275 and gamma flips accelerate downside.
High volatility pivot event: 11/07 Expect volume shifts into that date.
Strategy alignment: • Above $283 → call scalps into $286–$290 • Below $277 → puts toward $275–$270 • Between $278–$281 → premium chopping zone — avoid directional bias
TRADE SCENARIOS (Nov. 3–7)
✅ Bullish Setup
Trigger: Hold above $283 and break wedge resistance Entry: Retest $282.70–$283.10 Targets: $286.00 → $289.50 → $297.50 (call wall magnet) Stop: Below $281.20
Invalidation: breakdown of intraday trendline support.
✅ Bearish Setup
Trigger: Breakdown below $277** with confirmation** Entry: Retest $277–$277.30 Targets: $275 → $270 liquidity sweep Stop: Above $278.80
Invalidation: strong buy reaction + MACD shift at $277 pocket.
CLOSING OUTLOOK
GOOGL is stretched but not exhausted. As long as bulls defend $278–$281 early week, continuation trades remain valid.
However — if we reject $283 repeatedly with declining volume, look for a controlled pullback into trendline support around $256 later in the week.
Personally, I’m watching for quiet Monday accumulation under wedge resistance — that often precedes a mid-week expansion when volatility event catalysts arrive.
DISCLAIMER
This analysis is for educational purposes only and not financial advice. Always manage your risk and trade your own plan.
WEEKLY TIMEFRAME ANALYSIS
1. Market Structure
GOOGL remains in a dominant weekly uptrend with a clean BOS breakout over previous highs. The chart printed a shallow pullback that respected the mid-trendline before pushing higher — that’s characteristic of momentum-driven accumulation.
We saw previous CHoCH attempts during earnings volatility, but none sustained. That tells me smart money absorbed dips instead of distributing.
Major liquidity sits below: • $207–$210 • $186–$190
Above current price is discovery — thin liquidity, fast travel potential.
2. Supply & Demand / Order Blocks
There’s a bullish order block sitting right around $207–$210 that hasn’t been fully mitigated. If the market wants a discount, that’s the obvious landing spot.
Deeper demand lives at $140–$156, serving as the long-term institutional accumulation range.
Supply overhead begins in the $290–$300 band. That’s where short sellers tend to get aggressive and profit-takers defend levels.
3. Indicator Confluence
The 9EMA above 21EMA with strong slope confirms trend continuation. MACD histogram is showing large green bars — buyers still have authority. Stoch RSI is elevated but cycling with price, not diverging.
Volume expansion during push candles suggests trend confirmation, not exhaustion… yet.
4. Weekly Tone
Momentum is stretched, but dips continue to get bought. If the market pulls back into the mid-trendline, that will be a high-confluence area for continuation traders.
DAILY TIMEFRAME ANALYSIS
1. Market Structure
Daily candles show an extended channel grind higher. Friday printed a pullback wick from upper channel resistance — exactly where you’d expect algo sell programs to fire.
Key structure levels: • $256 support (micro trendline convergence) • $235 for deeper liquidity sweeps
A breakdown below $256 would telegraph distribution before continuation.
2. Supply & Demand / Order Blocks
Demand clusters: • $256–$258 (first bounce zone) • $235–$238 (secondary re-load if volatility spikes)
Supply clusters: • $281–$286 (multiple rejections) • $298–$300 psychological wall
Breaking $286 with volume opens the window to run trapped shorts quickly.
3. Indicator Confluence
The 9EMA is still above the 21EMA, but slope is flattening — early caution sign. MACD histogram is stabilizing after a strong push. Stoch RSI remains high but hasn’t crossed down yet — bulls still in control.
Volume is softening; expect mean reversion behavior early week.
4. Daily Tone
As long as GOOGL respects the mid-channel, dips are buyable. Lose the channel and we’ll rotate into liquidity pockets below $260.
15-MINUTE INTRADAY STRUCTURE
1. Market Structure
The 15m printed a CHoCH → BOS sequence after liquidity was swept at $277.04. Price then consolidated in a wedge under micro resistance — typical pre-break setup.
However, lack of continuation into close suggests market makers are waiting until liquidity opens Monday.
2. Supply & Demand / Order Blocks
Demand intraday: • $278.20–$279.20 (first bounce pocket) • $277.00–$277.50 (deeper wicks)
Supply intraday: • $283.00–$286.05 (active sell wall) • $289.50 liquidity shelf on upside rejection
Breakout above $283 will trap short scalpers.
3. Indicator Confluence
9EMA curling toward 21EMA, signaling potential early session squeeze. MACD histogram is flattening — momentum coiling. Stoch RSI is curling up from lower band — bullish inflection signal.
4. Intraday Tone
Expect fakeout volatility first 30 minutes. If micro trendline breaks with volume confirmation, watch for a push into $283+, possibly wicking into $286.
GEX (Gamma Exposure) & OPTIONS SENTIMENT
Call walls stack at: • $297.5 • $300 Strong gamma magnets if price enters that zone.
The highest positive NET GEX sits around $280.75 — this is why price keeps orbiting here. Dealers hedge around this level to reduce risk.
Put support sits at: • $275 • $265
Break below $275 and gamma flips accelerate downside.
High volatility pivot event: 11/07 Expect volume shifts into that date.
Strategy alignment: • Above $283 → call scalps into $286–$290 • Below $277 → puts toward $275–$270 • Between $278–$281 → premium chopping zone — avoid directional bias
TRADE SCENARIOS (Nov. 3–7)
✅ Bullish Setup
Trigger: Hold above $283 and break wedge resistance Entry: Retest $282.70–$283.10 Targets: $286.00 → $289.50 → $297.50 (call wall magnet) Stop: Below $281.20
Invalidation: breakdown of intraday trendline support.
✅ Bearish Setup
Trigger: Breakdown below $277** with confirmation** Entry: Retest $277–$277.30 Targets: $275 → $270 liquidity sweep Stop: Above $278.80
Invalidation: strong buy reaction + MACD shift at $277 pocket.
CLOSING OUTLOOK
GOOGL is stretched but not exhausted. As long as bulls defend $278–$281 early week, continuation trades remain valid.
However — if we reject $283 repeatedly with declining volume, look for a controlled pullback into trendline support around $256 later in the week.
Personally, I’m watching for quiet Monday accumulation under wedge resistance — that often precedes a mid-week expansion when volatility event catalysts arrive.
DISCLAIMER
This analysis is for educational purposes only and not financial advice. Always manage your risk and trade your own plan.
تم فتح الصفقة
GOOGL Outlook for Nov. 4GOOGL printed another CHoCH to the downside and failed to break the upper supply zone. Price also slipped back under the ascending trendline, shifting short-term momentum bearish. MACD and Stoch both continue to roll lower, showing sellers still pressing.
Support: 281.80 → 279.80 A break below opens room toward 276 liquidity.
Resistance: 283.95 → 285.50 Bulls must reclaim these levels for upside continuation.
Bias: Slightly bearish unless price reclaims 284+ with conviction.
Trade Idea: Rejecting 283.95–284.50 is a put scalp toward 281.80 → 279.80. Calls only if GOOGL pushes back above 285.50 and holds.
إخلاء المسؤولية
The information and publications are not meant to be, and do not constitute, financial, investment, trading, or other types of advice or recommendations supplied or endorsed by TradingView. Read more in the Terms of Use.
إخلاء المسؤولية
The information and publications are not meant to be, and do not constitute, financial, investment, trading, or other types of advice or recommendations supplied or endorsed by TradingView. Read more in the Terms of Use.