After being in a multi-year downtrend since its All-Time High (ATH) in August 2018, Graphite India (GRAPHITE) is showing compelling signs of a major trend reversal. Today's powerful price action has broken through two critical resistance levels, suggesting a new uptrend may be underway.
The Long-Term Bottoming Process
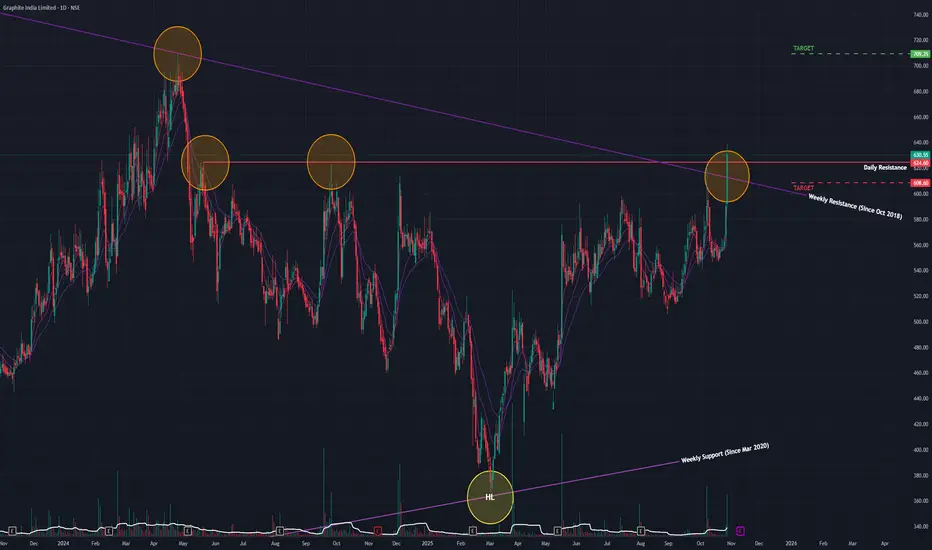
While the stock peaked in 2018, a very long-term bottoming process has been in place. Since April 2020, the stock has been forming a pattern of Higher Lows (clearly visible on the Monthly chart), indicating a gradual shift from supply to demand over the years. Although there was a more recent downtrend from May 2024, that appears to have reversed starting in March 2025.
Today's Decisive Dual Breakout
Today's session (Wednesday, October 29, 2025) was technically very significant:
- Strong Price Surge: The stock rallied by +6.82%.
- Massive Volume: The move was supported by a huge volume of 8.6 million shares, indicating strong buyer conviction.
- Dual Resistance Breach: In a powerful display, the stock broke out and closed above two key resistance levels simultaneously:
1. A long-term angular resistance trendline in place since October 2018.
2. A short-term horizontal resistance trendline formed since May 2024.
Breaking through a confluence of long-term and short-term resistance on high volume is a potent bullish signal.
Broad-Based Technical Strength
This breakout is strongly supported by a clear alignment of momentum indicators across all major timeframes (Monthly, Weekly, and Daily):
- Short-Term EMAs: All three timeframes are in a bullish Positive Crossover (PCO) state.
- RSI (Relative Strength Index): The RSI is also in a rising trend on all three timeframes.
Outlook and Key Levels to Watch
With this dual breakout, the technical landscape has shifted significantly in favor of the bulls.
- Bullish Target: If the stock can sustain this momentum, the next logical area of resistance and potential price target is the ₹709 level. The ideal confirmation, would be a successful re-test of the broken resistance zone followed by a bounce.
- Critical Support: If this breakout proves to be a "fakeout" and the price falls back below the broken resistance, the key support level to watch is ₹608. A close below this would negate the bullish signal.
In conclusion, today's action represents a potentially major turning point for Graphite India. Confirmation via a successful retest would provide the highest confidence that a new long-term uptrend has begun.
The Long-Term Bottoming Process
While the stock peaked in 2018, a very long-term bottoming process has been in place. Since April 2020, the stock has been forming a pattern of Higher Lows (clearly visible on the Monthly chart), indicating a gradual shift from supply to demand over the years. Although there was a more recent downtrend from May 2024, that appears to have reversed starting in March 2025.
Today's Decisive Dual Breakout
Today's session (Wednesday, October 29, 2025) was technically very significant:
- Strong Price Surge: The stock rallied by +6.82%.
- Massive Volume: The move was supported by a huge volume of 8.6 million shares, indicating strong buyer conviction.
- Dual Resistance Breach: In a powerful display, the stock broke out and closed above two key resistance levels simultaneously:
1. A long-term angular resistance trendline in place since October 2018.
2. A short-term horizontal resistance trendline formed since May 2024.
Breaking through a confluence of long-term and short-term resistance on high volume is a potent bullish signal.
Broad-Based Technical Strength
This breakout is strongly supported by a clear alignment of momentum indicators across all major timeframes (Monthly, Weekly, and Daily):
- Short-Term EMAs: All three timeframes are in a bullish Positive Crossover (PCO) state.
- RSI (Relative Strength Index): The RSI is also in a rising trend on all three timeframes.
Outlook and Key Levels to Watch
With this dual breakout, the technical landscape has shifted significantly in favor of the bulls.
- Bullish Target: If the stock can sustain this momentum, the next logical area of resistance and potential price target is the ₹709 level. The ideal confirmation, would be a successful re-test of the broken resistance zone followed by a bounce.
- Critical Support: If this breakout proves to be a "fakeout" and the price falls back below the broken resistance, the key support level to watch is ₹608. A close below this would negate the bullish signal.
In conclusion, today's action represents a potentially major turning point for Graphite India. Confirmation via a successful retest would provide the highest confidence that a new long-term uptrend has begun.
Disclaimer: This analysis is my personal view & for educational purposes only. They shall not be construed as trade or investment advice. Before making any financial decision, it is imperative that you consult with a qualified financial professional.
إخلاء المسؤولية
لا يُقصد بالمعلومات والمنشورات أن تكون، أو تشكل، أي نصيحة مالية أو استثمارية أو تجارية أو أنواع أخرى من النصائح أو التوصيات المقدمة أو المعتمدة من TradingView. اقرأ المزيد في شروط الاستخدام.