Current Price (Pre-Opening): ₹1,992.60 (an increase of 4.40, or 0.22%)
Previous Close: ₹1,988.20
Day’s Range: ₹1,983.20 – ₹1,997.50
52-Week Range: ₹1,613.00 – ₹2,037.70
4-Hour Time-Frame Levels (Support & Resistance)
While I couldn’t find a source specifically providing 4-hour timeframe levels for HDFC Bank, here's a useful Elliott Wave–based analysis on the 4-hour chart for guidance:
Support (Invalidation Level): ₹1,590 — if the stock dips below this, the current wave structure may be negated.
Key Pivot Zone: ₹1,710–₹1,720 — around here, bulls might regain control.
Upside Target: Break above ₹1,800 could trigger accelerated upward momentum, with a broader move toward ₹1,970–₹2,000 in progress.
Interpretation & Strategy Implications
Key short-term support lies near ₹1,590. A break below this invalidates the bullish wave setup and warrants caution.
If the stock holds above ₹1,710–₹1,720, buyers could step in, leading to upward momentum toward and beyond ₹1,800.
Daily resistance zones:
Immediate resistance: ₹2,030
Momentum breakout zone: ₹2,050
Major resistance: ₹2,100
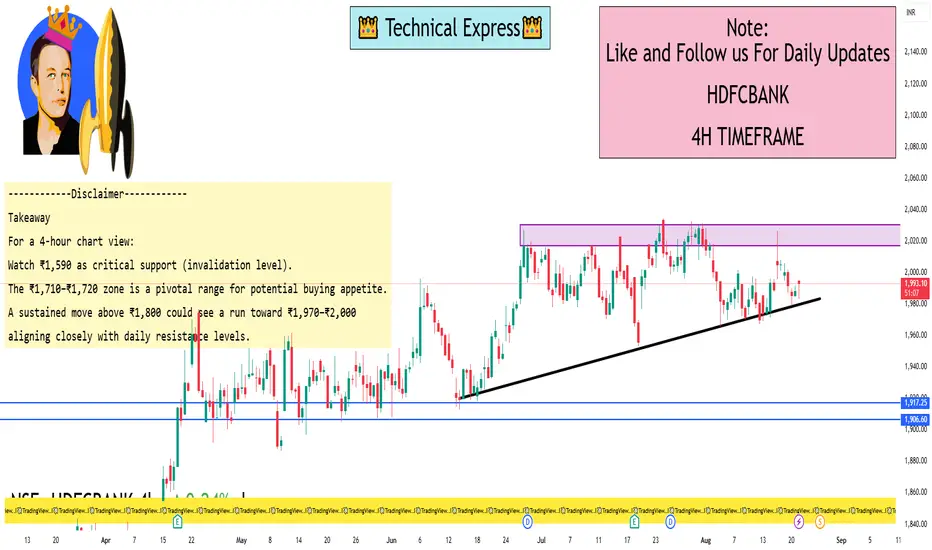
Takeaway
For a 4-hour chart view:
Watch ₹1,590 as critical support (invalidation level).
The ₹1,710–₹1,720 zone is a pivotal range for potential buying appetite.
A sustained move above ₹1,800 could see a run toward ₹1,970–₹2,000, aligning closely with daily resistance levels.
Previous Close: ₹1,988.20
Day’s Range: ₹1,983.20 – ₹1,997.50
52-Week Range: ₹1,613.00 – ₹2,037.70
4-Hour Time-Frame Levels (Support & Resistance)
While I couldn’t find a source specifically providing 4-hour timeframe levels for HDFC Bank, here's a useful Elliott Wave–based analysis on the 4-hour chart for guidance:
Support (Invalidation Level): ₹1,590 — if the stock dips below this, the current wave structure may be negated.
Key Pivot Zone: ₹1,710–₹1,720 — around here, bulls might regain control.
Upside Target: Break above ₹1,800 could trigger accelerated upward momentum, with a broader move toward ₹1,970–₹2,000 in progress.
Interpretation & Strategy Implications
Key short-term support lies near ₹1,590. A break below this invalidates the bullish wave setup and warrants caution.
If the stock holds above ₹1,710–₹1,720, buyers could step in, leading to upward momentum toward and beyond ₹1,800.
Daily resistance zones:
Immediate resistance: ₹2,030
Momentum breakout zone: ₹2,050
Major resistance: ₹2,100
Takeaway
For a 4-hour chart view:
Watch ₹1,590 as critical support (invalidation level).
The ₹1,710–₹1,720 zone is a pivotal range for potential buying appetite.
A sustained move above ₹1,800 could see a run toward ₹1,970–₹2,000, aligning closely with daily resistance levels.
I built a Buy & Sell Signal Indicator with 85% accuracy.
📈 Get access via DM or
WhatsApp: wa.link/d997q0
| Email: techncialexpress@gmail.com
| Script Coder | Trader | Investor | From India
📈 Get access via DM or
WhatsApp: wa.link/d997q0
| Email: techncialexpress@gmail.com
| Script Coder | Trader | Investor | From India
منشورات ذات صلة
إخلاء المسؤولية
لا يُقصد بالمعلومات والمنشورات أن تكون، أو تشكل، أي نصيحة مالية أو استثمارية أو تجارية أو أنواع أخرى من النصائح أو التوصيات المقدمة أو المعتمدة من TradingView. اقرأ المزيد في شروط الاستخدام.