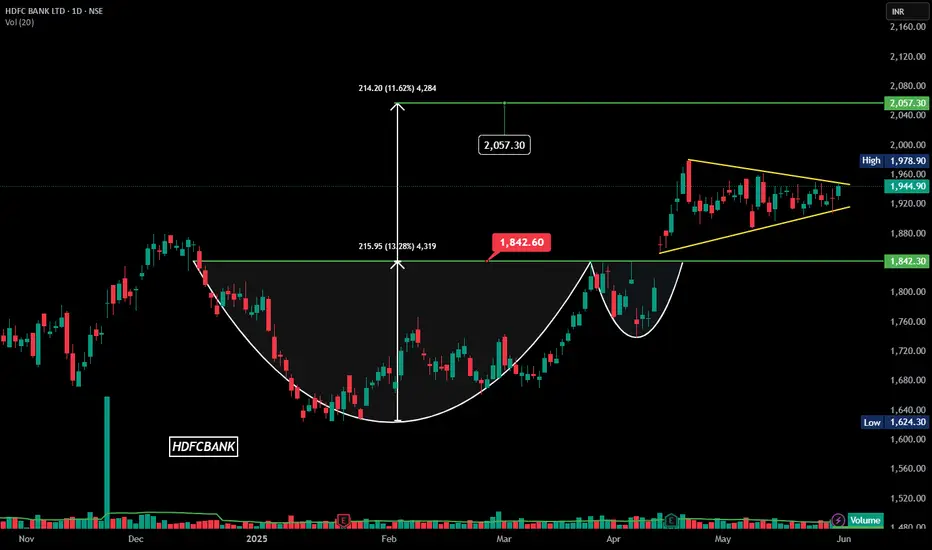
### **Technical Analysis of HDFC Bank Ltd. (NSE)**
The **daily candlestick chart** of **HDFC Bank Ltd.** highlights key technical patterns, suggesting potential bullish momentum.
### **Key Observations:**
1. **Cup and Handle Formation:**
- A well-defined **cup and handle** pattern is visible, indicating prolonged accumulation.
- Breakout above **1,960.00 INR** confirms bullish sentiment.
- **Projected Target:** **2,057.30 INR**, a **11.62% upside** from breakout.
2. **Symmetrical Triangle Breakout:**
- Price action consolidating within a **symmetrical triangle**, leading to breakout confirmation.
- Strong move above **1,944.90 INR**, validating upward momentum.
3. **Volume & Price Action:**
- **Volume:** **14.37M** surpassing 20-day moving average of **10.13M**, confirming strength.
### **Support & Resistance Levels:**
- **Support:** **1,842.00 INR**, acting as a key cushion in case of pullbacks.
- **Resistance:** **2,057.30 INR**, aligning with the measured move projection.
إخلاء المسؤولية
لا يُقصد بالمعلومات والمنشورات أن تكون، أو تشكل، أي نصيحة مالية أو استثمارية أو تجارية أو أنواع أخرى من النصائح أو التوصيات المقدمة أو المعتمدة من TradingView. اقرأ المزيد في شروط الاستخدام.
إخلاء المسؤولية
لا يُقصد بالمعلومات والمنشورات أن تكون، أو تشكل، أي نصيحة مالية أو استثمارية أو تجارية أو أنواع أخرى من النصائح أو التوصيات المقدمة أو المعتمدة من TradingView. اقرأ المزيد في شروط الاستخدام.