Hello, traders. Nice to meet you.
By "Following," you can always get the latest information quickly.
Have a nice day today.
-------------------------------------
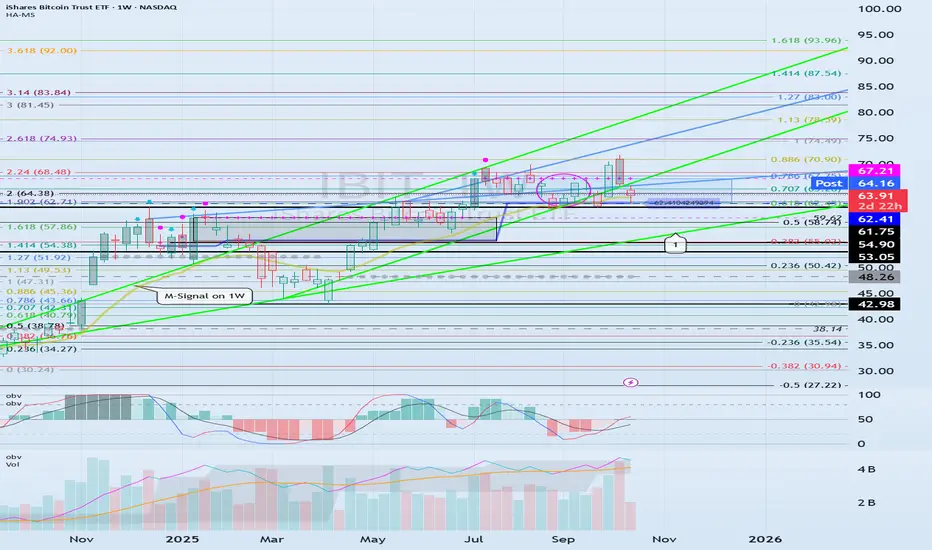
(IBIT 1W Chart)
Since the chart was created recently, the M-Signal indicator for the 1M chart is missing.
However, the HA-High and DOM (60) indicators indicate a stepwise upward trend.
The key question is whether the price can maintain its upward momentum above the HA-High ~ DOM (60) range of 62.41-67.21.
If it falls below 62.41, it is likely to touch the uptrend line (1) and re-establish the trend.
At this point, the key support and resistance levels are 53.05-54.90.
We need to check for support near this 53.05-54.90 range.
If it rises above 67.21, the target levels are:
1st: 74.93
2nd: 93.96
The target levels are expected to be around the first and second levels above.
--------------------------------------------------------
Because BTC is linked to the stock market and is being linked to it, it is highly likely to be affected by stock market movements.
However, it is always advisable to check the fund flow in the coin market first, as the coin market itself can exhibit price defense.
-
Thank you for reading to the end.
I wish you successful trading.
--------------------------------------------------
※ Follow X to check out the posts.
※ X를 팔로우하고 게시물을 확인하세요.
◆ t.me/readCryptoChannel
[HA-MS Indicator]
bit.ly/3YxHgvN
[OBV Indicator]
bit.ly/4dcyny3
※ X를 팔로우하고 게시물을 확인하세요.
◆ t.me/readCryptoChannel
[HA-MS Indicator]
bit.ly/3YxHgvN
[OBV Indicator]
bit.ly/4dcyny3
منشورات ذات صلة
إخلاء المسؤولية
لا يُقصد بالمعلومات والمنشورات أن تكون، أو تشكل، أي نصيحة مالية أو استثمارية أو تجارية أو أنواع أخرى من النصائح أو التوصيات المقدمة أو المعتمدة من TradingView. اقرأ المزيد في شروط الاستخدام.