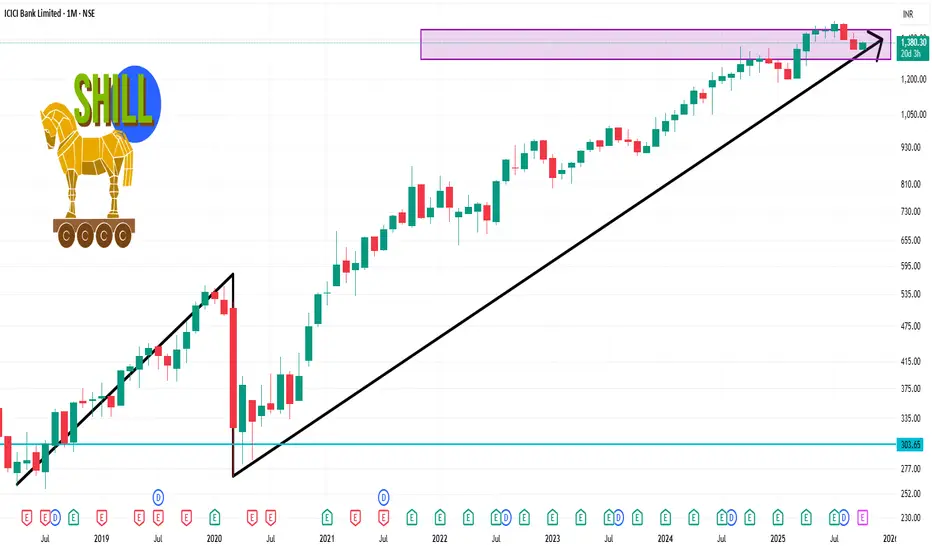
📊 Monthly Technical Levels
Pivot Point: ₹1,374.47
Support Levels:
S1: ₹1,316.13
S2: ₹1,284.27
S3: ₹1,225.93
Resistance Levels:
R1: ₹1,406.33
R2: ₹1,464.67
R3: ₹1,496.53
These levels are derived from standard pivot point calculations and can serve as key reference points for traders.
🔍 Technical Indicators
Relative Strength Index (RSI): Currently at 46.06, indicating a neutral condition, suggesting no immediate overbought or oversold conditions.
Moving Averages: The stock is showing a buy signal across various moving averages, with 8 buy signals and 4 sell signals, suggesting a bullish trend.
Technical Indicators: A strong buy signal is observed, with 10 buy signals and no sell signals, indicating positive momentum.
منشورات ذات صلة
إخلاء المسؤولية
لا يُقصد بالمعلومات والمنشورات أن تكون، أو تشكل، أي نصيحة مالية أو استثمارية أو تجارية أو أنواع أخرى من النصائح أو التوصيات المقدمة أو المعتمدة من TradingView. اقرأ المزيد في شروط الاستخدام.
منشورات ذات صلة
إخلاء المسؤولية
لا يُقصد بالمعلومات والمنشورات أن تكون، أو تشكل، أي نصيحة مالية أو استثمارية أو تجارية أو أنواع أخرى من النصائح أو التوصيات المقدمة أو المعتمدة من TradingView. اقرأ المزيد في شروط الاستخدام.