🟢 Chart Overview – Indo Count
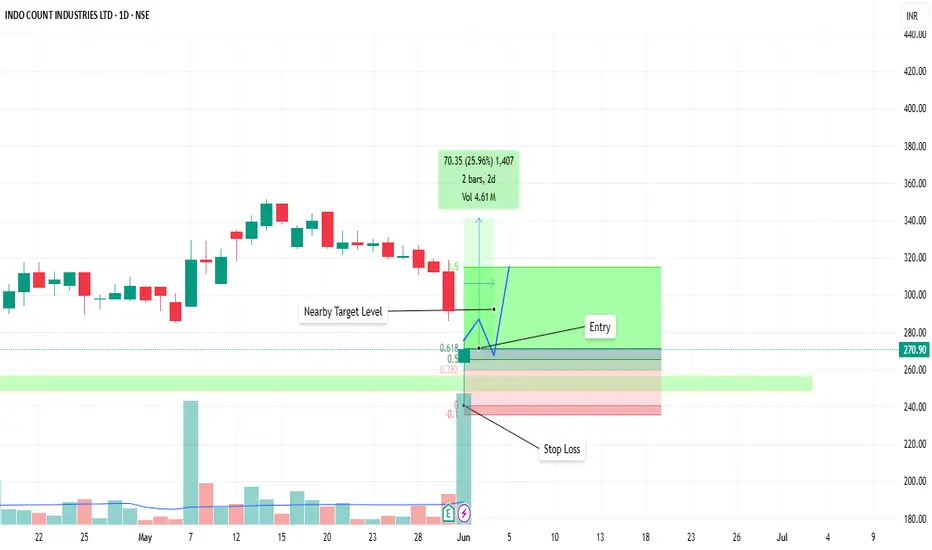
Current Price: ₹270.90
Change: -₹20.90 (−7.16%)
Volume: 4.61M, extremely high compared to 50-day average of 774K
🔍 Key Technical Observations
Observation Insight
🔻 Sharp Drop Today Price crashed ~7% with massive volume. A panic/fear-based move is likely.
🟩 Support Zone Tested Price touched the ₹245–265 green support zone, which has held strong since Dec 2023.
🔼 Intraday Reversal Wick Long lower shadow shows demand came in near support. This is a bullish sign if followed up by a green candle.
📈 Volume Spike One of the highest volumes in the past year, usually indicating capitulation or smart money accumulation.
📊 GK Wealth Creation Indicator Band extremes show price is hitting lower volatility thresholds, often coinciding with reversal areas.
📌 Key Levels to Watch
Type Price Range
✅ Major Support Zone ₹245 – ₹265
⚠️ Immediate Resistance ₹295 – ₹305
🟢 Bullish Signal Strong close above ₹285 with volume
🛑 Bearish Breakdown Close below ₹240 = major structure break
🧠 Strategy Suggestion
🔁 Swing Trade Possibility
Position Entry Range Stop-Loss Targets Confidence
Long ₹255–₹270 ₹238 ₹295 / ₹310 Moderate (needs confirmation tomorrow)
Wait for a green bullish candle with above-average volume before entering.
🧩 Summary
Metric Status
Trend Bearish short-term, but at support
Volume Extremely high – possible turning point
Structure Holding previous support zone
Reversal Signs Present but needs confirmation
Risk Level Moderate-High (tight stop essential)
منشورات ذات صلة
إخلاء المسؤولية
لا يُقصد بالمعلومات والمنشورات أن تكون، أو تشكل، أي نصيحة مالية أو استثمارية أو تجارية أو أنواع أخرى من النصائح أو التوصيات المقدمة أو المعتمدة من TradingView. اقرأ المزيد في شروط الاستخدام.
منشورات ذات صلة
إخلاء المسؤولية
لا يُقصد بالمعلومات والمنشورات أن تكون، أو تشكل، أي نصيحة مالية أو استثمارية أو تجارية أو أنواع أخرى من النصائح أو التوصيات المقدمة أو المعتمدة من TradingView. اقرأ المزيد في شروط الاستخدام.