🔎 Technical Overview
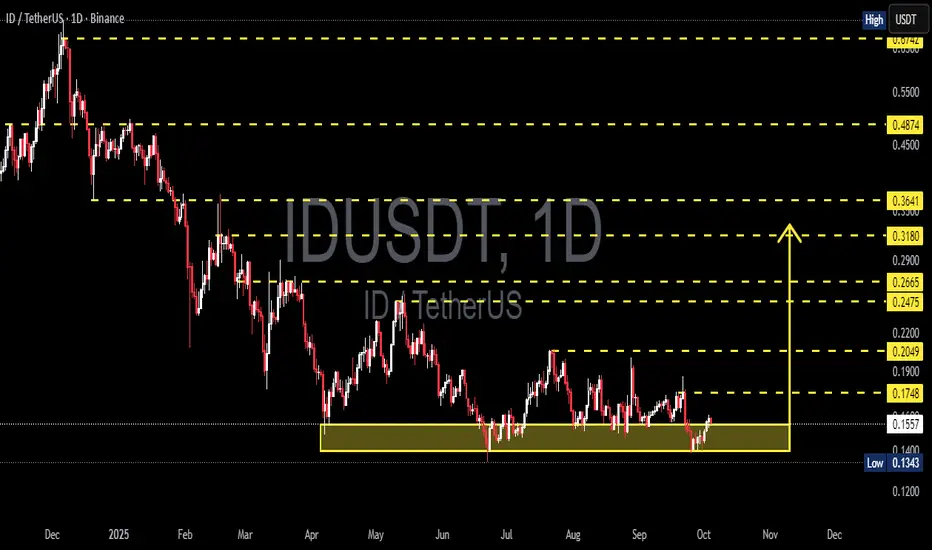
IDUSDT is currently consolidating within a major support zone at 0.1343 – 0.1554 (highlighted yellow box on the chart). This level has been tested multiple times since May 2025, proving that buyers are still defending it.
The price action forms a rectangle accumulation zone, but also resembles a descending triangle as lower highs continue to appear. This means the next move will depend on whether we see a confirmed breakout or a breakdown.
---
🟢 Bullish Scenario
If the price manages to hold above support and break key resistance levels:
First trigger: daily close above 0.1748
Strong confirmation: daily close above 0.2049
Upside targets:
🎯 0.2475 – 0.2665
🎯 0.3180
🎯 0.3641
Each higher resistance break increases the probability of a trend reversal.
---
🔴 Bearish Scenario
If selling pressure dominates and the support fails:
Main trigger: daily close below 0.1343
Implication: breakdown from the accumulation zone → continuation of the downtrend.
Downside target: psychological area below 0.120 (check lower TF for minor supports).
A breakdown here could extend the bearish trend significantly.
---
📌 Visible Patterns
Rectangle Accumulation: price consolidating in a horizontal range, awaiting direction.
Descending Triangle: sellers still pressuring with lower highs.
Demand Zone: 0.1343 – 0.1554 is the key battleground between bulls and bears.
---
⚖️ Conclusion
IDUSDT is at a critical decision point.
Bullish case: breakout above 0.1748 – 0.2049 with strong volume, targeting higher resistance zones.
Bearish case: breakdown below 0.1343, opening downside potential toward 0.120 and lower.
Traders should wait for a confirmed breakout/breakdown before entering positions, while maintaining strict risk management (stop loss at invalidation levels).
---
📌 Key Levels for IDUSDT
Support: 0.1343 – 0.1554
Resistance: 0.1748 – 0.2049
Bullish Targets: 0.2475 – 0.2665 → 0.3180 → 0.3641
Bearish Target: below 0.1343 (towards 0.12 zone)
---
#IDUSDT #CryptoAnalysis #Altcoin #Breakout #SupportResistance #TechnicalAnalysis #BullishScenario #BearishScenario
✅ Get Free Signals! Join Our Telegram Channel Here: t.me/TheCryptoNuclear
✅ Twitter: twitter.com/crypto_nuclear
✅ Join Bybit : partner.bybit.com/b/nuclearvip
✅ Benefits : Lifetime Trading Fee Discount -50%
✅ Twitter: twitter.com/crypto_nuclear
✅ Join Bybit : partner.bybit.com/b/nuclearvip
✅ Benefits : Lifetime Trading Fee Discount -50%
إخلاء المسؤولية
لا يُقصد بالمعلومات والمنشورات أن تكون، أو تشكل، أي نصيحة مالية أو استثمارية أو تجارية أو أنواع أخرى من النصائح أو التوصيات المقدمة أو المعتمدة من TradingView. اقرأ المزيد في شروط الاستخدام.