Technical Overview:
Overall Signal: Strong Buy
Moving Averages: All moving averages (5, 10, 20, 50, 100, 200) are indicating a Buy signal.
RSI (14): 90.29 – Overbought (indicates strong upward momentum)
MACD: 24.38 – Positive (supports bullish trend)
Stochastic RSI: 95.20 – Overbought (suggests potential for a pullback)
CCI (14): 194.96 – Positive (indicates strong trend strength)
ADX (14): 35.55 – Strong trend (above 25 indicates a strong trend)
ATR (14): 14.44 – High volatility (indicates significant price movement)
Pivot Points:
Resistance Levels: R1: ₹565.46, R2: ₹570.23, R3: ₹577.96
Support Levels: S1: ₹552.96, S2: ₹545.23, S3: ₹540.46
Price Action:
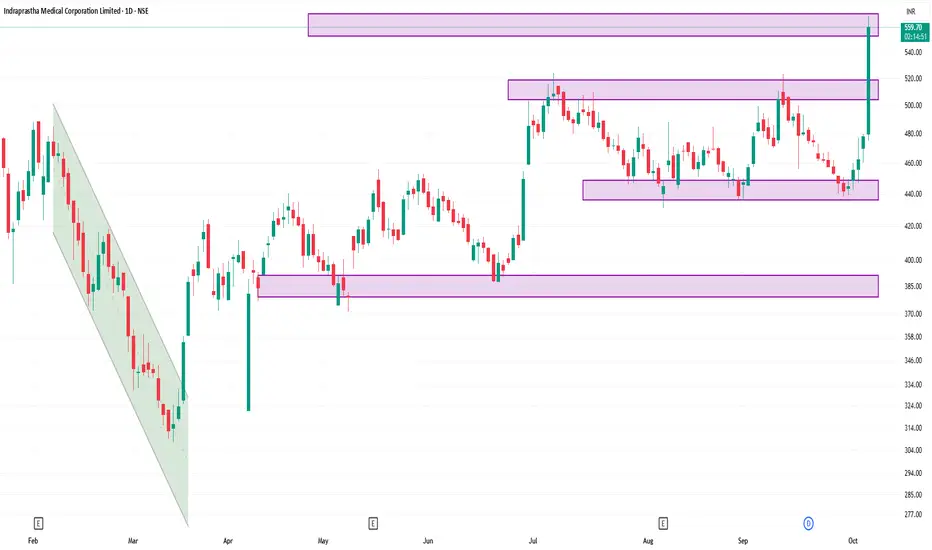
Current Price: ₹559.50
Day Range: ₹475.00 – ₹568.90
Previous Close: ₹478.10
Volume: Approximately 4.5 million shares traded
VWAP: ₹541.59
52-Week High/Low: ₹572.00 / ₹307.25
Summary:
The stock is currently trading near its 52-week high, indicating strong investor confidence. Technical indicators suggest a robust bullish trend, though the overbought conditions (RSI and Stochastic RSI) may imply a potential short-term pullback. Traders should monitor for any signs of reversal or consolidation near resistance levels.
Overall Signal: Strong Buy
Moving Averages: All moving averages (5, 10, 20, 50, 100, 200) are indicating a Buy signal.
RSI (14): 90.29 – Overbought (indicates strong upward momentum)
MACD: 24.38 – Positive (supports bullish trend)
Stochastic RSI: 95.20 – Overbought (suggests potential for a pullback)
CCI (14): 194.96 – Positive (indicates strong trend strength)
ADX (14): 35.55 – Strong trend (above 25 indicates a strong trend)
ATR (14): 14.44 – High volatility (indicates significant price movement)
Pivot Points:
Resistance Levels: R1: ₹565.46, R2: ₹570.23, R3: ₹577.96
Support Levels: S1: ₹552.96, S2: ₹545.23, S3: ₹540.46
Price Action:
Current Price: ₹559.50
Day Range: ₹475.00 – ₹568.90
Previous Close: ₹478.10
Volume: Approximately 4.5 million shares traded
VWAP: ₹541.59
52-Week High/Low: ₹572.00 / ₹307.25
Summary:
The stock is currently trading near its 52-week high, indicating strong investor confidence. Technical indicators suggest a robust bullish trend, though the overbought conditions (RSI and Stochastic RSI) may imply a potential short-term pullback. Traders should monitor for any signs of reversal or consolidation near resistance levels.
منشورات ذات صلة
إخلاء المسؤولية
لا يُقصد بالمعلومات والمنشورات أن تكون، أو تشكل، أي نصيحة مالية أو استثمارية أو تجارية أو أنواع أخرى من النصائح أو التوصيات المقدمة أو المعتمدة من TradingView. اقرأ المزيد في شروط الاستخدام.
منشورات ذات صلة
إخلاء المسؤولية
لا يُقصد بالمعلومات والمنشورات أن تكون، أو تشكل، أي نصيحة مالية أو استثمارية أو تجارية أو أنواع أخرى من النصائح أو التوصيات المقدمة أو المعتمدة من TradingView. اقرأ المزيد في شروط الاستخدام.