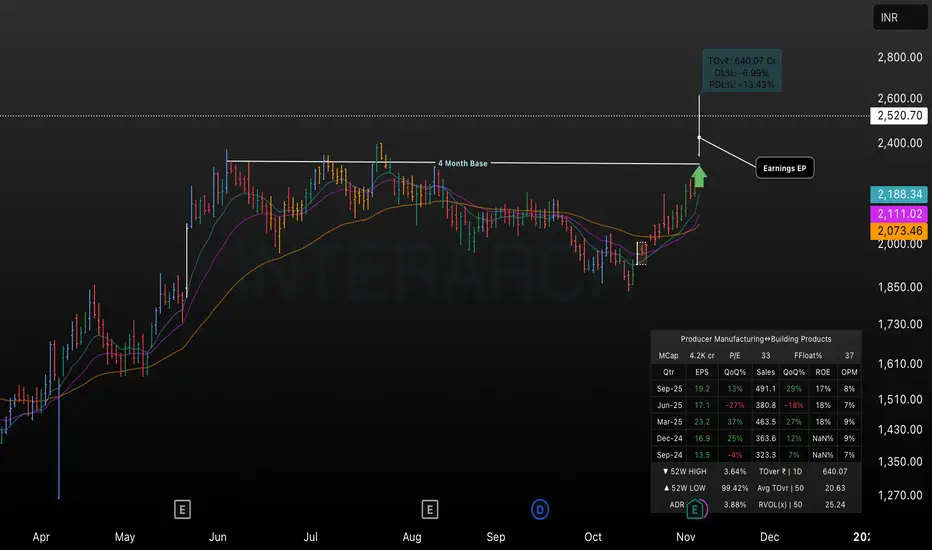
This TradingView chart highlights Interarch’s significant breakout above a 4-month consolidation base, with the price rallying to ₹2,520.70 (+14.87%). Key moving averages are displayed, and the breakout is supported by positive earnings momentum. The annotation indicates an earnings event driving the move. The chart includes box statistics for financials such as market cap, P/E ratio, and quarterly performance, helping visualize recent company fundamentals and price action context.
إخلاء المسؤولية
لا يُقصد بالمعلومات والمنشورات أن تكون، أو تشكل، أي نصيحة مالية أو استثمارية أو تجارية أو أنواع أخرى من النصائح أو التوصيات المقدمة أو المعتمدة من TradingView. اقرأ المزيد في شروط الاستخدام.
إخلاء المسؤولية
لا يُقصد بالمعلومات والمنشورات أن تكون، أو تشكل، أي نصيحة مالية أو استثمارية أو تجارية أو أنواع أخرى من النصائح أو التوصيات المقدمة أو المعتمدة من TradingView. اقرأ المزيد في شروط الاستخدام.