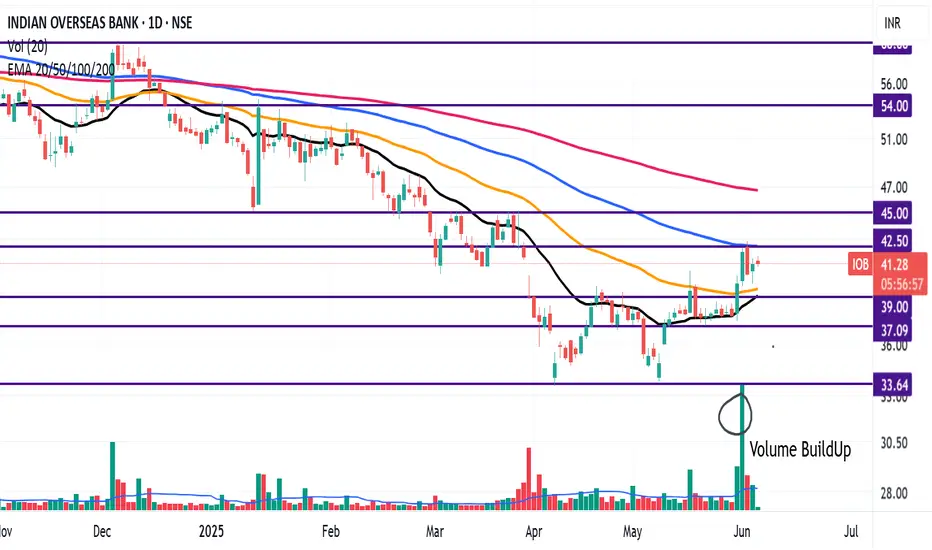
IOB is trading above 20 EMA (black Line), 50 EMA (Orange Line), and nearing the 100 EMAs (Blue Line) However, it is well below the 200 EMA (Pink line).
Recently the stock turned bullish, after taking support around 20EMA.
Volume Buildup also confirms the change in trend.
We have seen spurt in volume in the last few sessions, however, on weekly chart the 20 EMA (Black line) has to traverse above the 50 EMA (Orange line) to confirm the Bullish trend.
Resistance levels: 43, 45, 53, 60
Support levels: 39, 37, 33
إخلاء المسؤولية
لا يُقصد بالمعلومات والمنشورات أن تكون، أو تشكل، أي نصيحة مالية أو استثمارية أو تجارية أو أنواع أخرى من النصائح أو التوصيات المقدمة أو المعتمدة من TradingView. اقرأ المزيد في شروط الاستخدام.
إخلاء المسؤولية
لا يُقصد بالمعلومات والمنشورات أن تكون، أو تشكل، أي نصيحة مالية أو استثمارية أو تجارية أو أنواع أخرى من النصائح أو التوصيات المقدمة أو المعتمدة من TradingView. اقرأ المزيد في شروط الاستخدام.