Indian Oil Corp (IOC) is showing a strong bullish structure, but it has arrived at a critical juncture where two significant resistance levels are converging. The price action suggests a battle between buyers and sellers is underway, and a decisive move is imminent.
The Bullish Foundation
After a year-long downtrend that ended in February 2025, the stock has carved out a clear new uptrend, consistently forming higher highs and higher lows. This upward momentum is well-supported by multiple technical indicators:
- Golden Crossover: A long-term bullish "Golden Crossover" of the Simple Moving Averages (SMAs) occurred a few months ago.
- Indicator Strength: The short-term Exponential Moving Averages (EMAs) and the Relative Strength Index (RSI) are in a bullish state across the Monthly, Weekly, and Daily timeframes.
The Resistance Test: A Mixed Signal
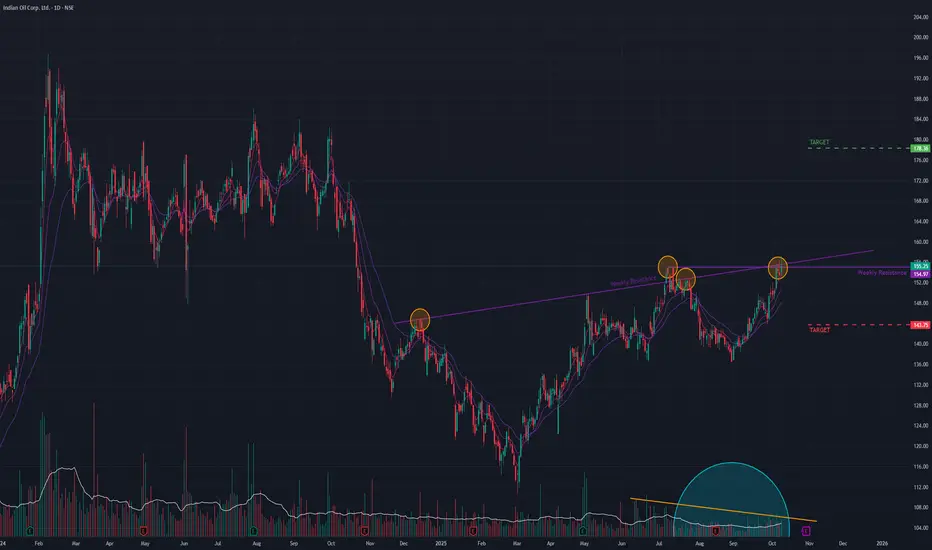
The primary challenge for IOC is a confluence of two resistance trendlines: a long-term angular resistance and a short-term horizontal resistance.
Today's trading session was a clear attempt to breach this zone, which resulted in a mixed signal:
- Partial Success: The stock managed to close above the short-term horizontal trendline, a minor positive.
- Key Rejection: However, while it did trade above the more critical long-term angular trendline intraday, it failed to hold these gains and closed below it.
This failure to close above the long-term resistance, combined with consolidating (non-expanding) volume, suggests that sellers are still active and buyers currently lack the conviction to force a decisive breakout.
Outlook and Key Levels
The next few trading sessions are crucial and will provide clarity.
- Bullish Scenario: A convincing daily close above the long-term angular trendline, especially if accompanied by an increase in volume, would confirm the breakout and signal a move towards the ₹178 level.
- Bearish Scenario: Continued rejection from this trendline could lead to a pullback, with the stock likely to find support around the ₹141 level.
The current price action warrants close monitoring. A breakout is clearly being attempted, but confirmation is required before a new directional trend can be established.
The Bullish Foundation
After a year-long downtrend that ended in February 2025, the stock has carved out a clear new uptrend, consistently forming higher highs and higher lows. This upward momentum is well-supported by multiple technical indicators:
- Golden Crossover: A long-term bullish "Golden Crossover" of the Simple Moving Averages (SMAs) occurred a few months ago.
- Indicator Strength: The short-term Exponential Moving Averages (EMAs) and the Relative Strength Index (RSI) are in a bullish state across the Monthly, Weekly, and Daily timeframes.
The Resistance Test: A Mixed Signal
The primary challenge for IOC is a confluence of two resistance trendlines: a long-term angular resistance and a short-term horizontal resistance.
Today's trading session was a clear attempt to breach this zone, which resulted in a mixed signal:
- Partial Success: The stock managed to close above the short-term horizontal trendline, a minor positive.
- Key Rejection: However, while it did trade above the more critical long-term angular trendline intraday, it failed to hold these gains and closed below it.
This failure to close above the long-term resistance, combined with consolidating (non-expanding) volume, suggests that sellers are still active and buyers currently lack the conviction to force a decisive breakout.
Outlook and Key Levels
The next few trading sessions are crucial and will provide clarity.
- Bullish Scenario: A convincing daily close above the long-term angular trendline, especially if accompanied by an increase in volume, would confirm the breakout and signal a move towards the ₹178 level.
- Bearish Scenario: Continued rejection from this trendline could lead to a pullback, with the stock likely to find support around the ₹141 level.
The current price action warrants close monitoring. A breakout is clearly being attempted, but confirmation is required before a new directional trend can be established.
Disclaimer: This analysis is my personal view & for educational purposes only. They shall not be construed as trade or investment advice. Before making any financial decision, it is imperative that you consult with a qualified financial professional.
إخلاء المسؤولية
لا يُقصد بالمعلومات والمنشورات أن تكون، أو تشكل، أي نصيحة مالية أو استثمارية أو تجارية أو أنواع أخرى من النصائح أو التوصيات المقدمة أو المعتمدة من TradingView. اقرأ المزيد في شروط الاستخدام.