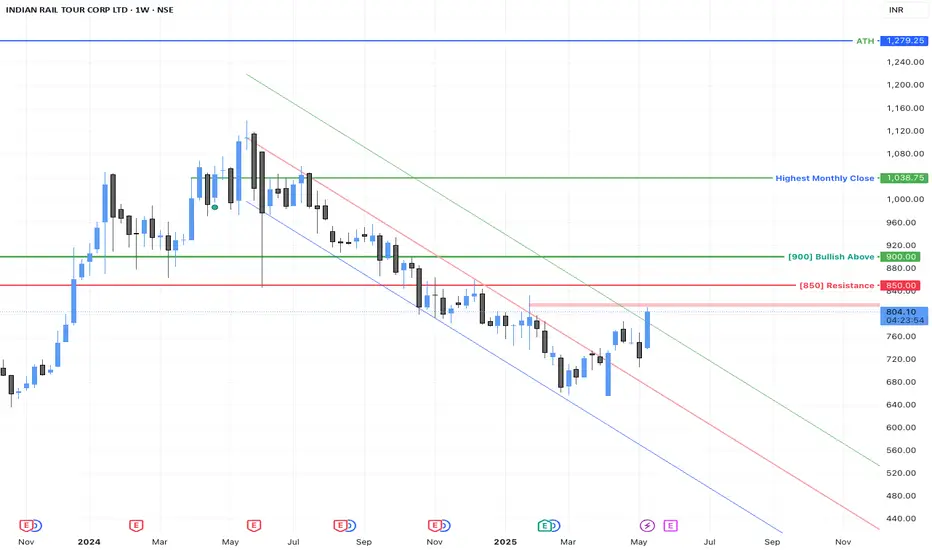
IRCTC weekly chart confirmed a breakout from the channel it was trading for the last one year.
Short term resistance around 815.
Look for signs of reversal near 850.
The stock will turn bullish only after a strong close above 900 (will small investors get a chance here?). After 900, target is only upto 1000 - if the stock needs to move higher, it needs to consolidate for few months.
Disclaimer: Only for educational purpose - not a buy / sell recommendation.
إخلاء المسؤولية
لا يُقصد بالمعلومات والمنشورات أن تكون، أو تشكل، أي نصيحة مالية أو استثمارية أو تجارية أو أنواع أخرى من النصائح أو التوصيات المقدمة أو المعتمدة من TradingView. اقرأ المزيد في شروط الاستخدام.
إخلاء المسؤولية
لا يُقصد بالمعلومات والمنشورات أن تكون، أو تشكل، أي نصيحة مالية أو استثمارية أو تجارية أو أنواع أخرى من النصائح أو التوصيات المقدمة أو المعتمدة من TradingView. اقرأ المزيد في شروط الاستخدام.