Refer to my earlier chart here
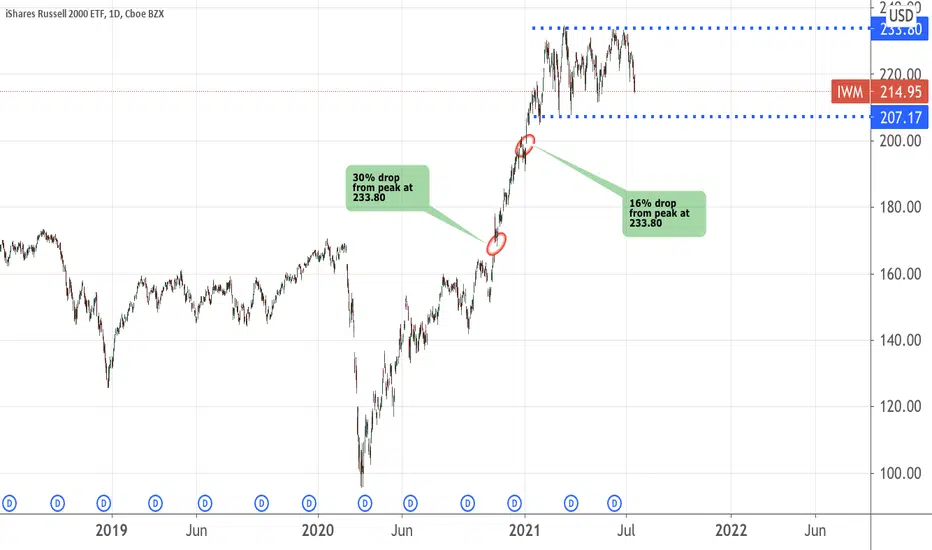
The Russell 2000 is giving us clear clues to how the market is likely going to behave in the coming months. It has not been successful breaking out of the resistance at 233.80 since March 2021.
It made attempts in Jun and July 2021 but both failed miserably! The straw that is going to break the camel's back will be the support at 207.17. In the coming weeks, watch this chart closely. If it falls below this level, then it is likely to head towards 199 level to close the first gap.
Worst case scenario, it will head further south to 165 level.
Please do your own due diligence.
ملاحظة
Congrats to those who followed. 2 of the gaps have been filled. Time to take some partial profits,adjust your trailing SL and let the remaining units run.....إخلاء المسؤولية
لا يُقصد بالمعلومات والمنشورات أن تكون، أو تشكل، أي نصيحة مالية أو استثمارية أو تجارية أو أنواع أخرى من النصائح أو التوصيات المقدمة أو المعتمدة من TradingView. اقرأ المزيد في شروط الاستخدام.
إخلاء المسؤولية
لا يُقصد بالمعلومات والمنشورات أن تكون، أو تشكل، أي نصيحة مالية أو استثمارية أو تجارية أو أنواع أخرى من النصائح أو التوصيات المقدمة أو المعتمدة من TradingView. اقرأ المزيد في شروط الاستخدام.