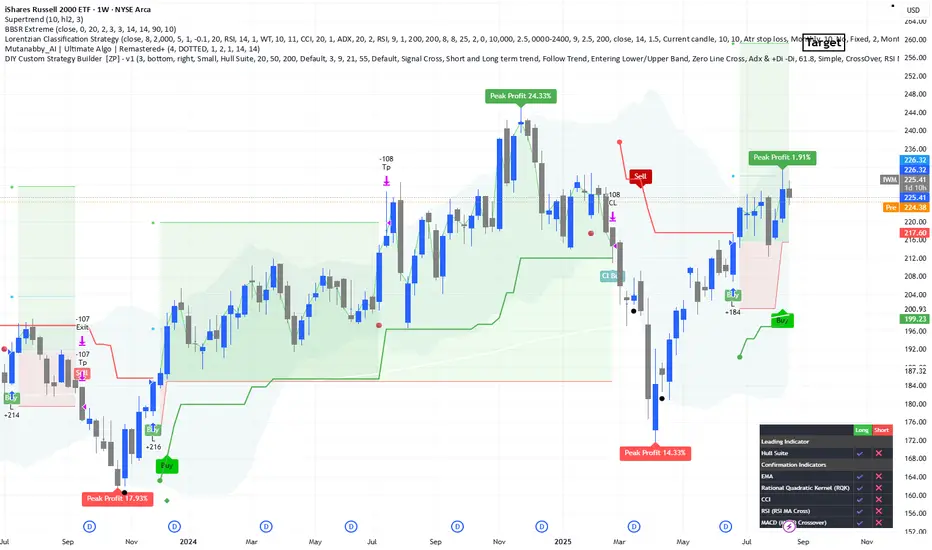
Spotted a promising long setup on the iShares Russell 2000 ETF (IWM) weekly chart. The price action is showing bullish momentum supported by volume and trend indicators.
🔹 Entry Zone: Current levels
🔹 Stop Loss: 196$ – below super trend line
🔹 Target: 260$
Technical indicators and moving averages are aligning for a potential breakout. Risk management is key – keep an eye on volume and macro sentiment.
Let me know your thoughts or if you're watching IWM too!
#IWM #Russell2000 #ETF #TechnicalAnalysis #SwingTrade #TradingSetup #Finance
إخلاء المسؤولية
لا يُقصد بالمعلومات والمنشورات أن تكون، أو تشكل، أي نصيحة مالية أو استثمارية أو تجارية أو أنواع أخرى من النصائح أو التوصيات المقدمة أو المعتمدة من TradingView. اقرأ المزيد في شروط الاستخدام.
إخلاء المسؤولية
لا يُقصد بالمعلومات والمنشورات أن تكون، أو تشكل، أي نصيحة مالية أو استثمارية أو تجارية أو أنواع أخرى من النصائح أو التوصيات المقدمة أو المعتمدة من TradingView. اقرأ المزيد في شروط الاستخدام.