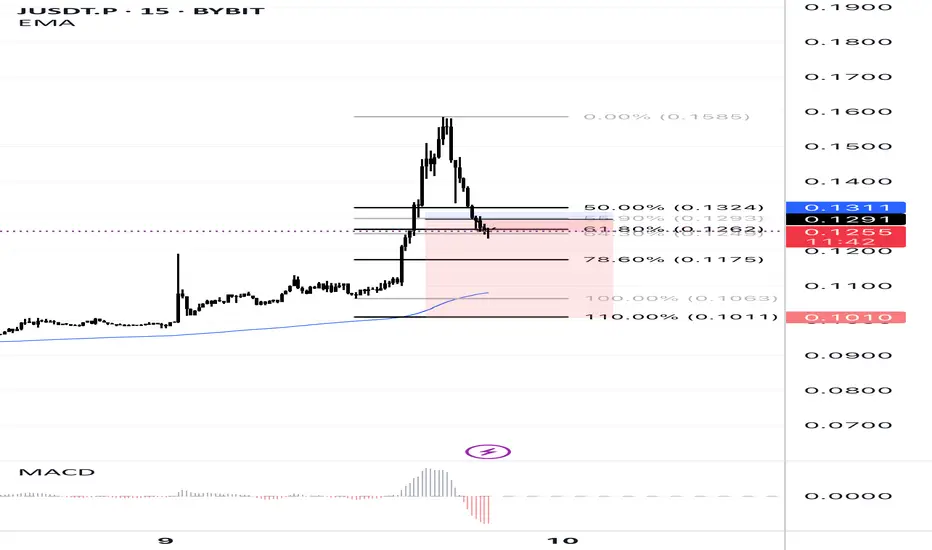
This 15-minute chart of JUSDT.P highlights a sharp price spike followed by a retracement. Key Fibonacci levels (50%, 61.8%, 78.6%) are marked to identify potential support zones. The price is currently testing the 61.8% retracement level, with the EMA acting as dynamic support. MACD shows bearish momentum after the recent peak, indicating a possible continuation of the retracement or consolidation phase. Watch for price action around the 0.1260 - 0.1320 range for potential reversal or breakdown.
إخلاء المسؤولية
لا يُقصد بالمعلومات والمنشورات أن تكون، أو تشكل، أي نصيحة مالية أو استثمارية أو تجارية أو أنواع أخرى من النصائح أو التوصيات المقدمة أو المعتمدة من TradingView. اقرأ المزيد في شروط الاستخدام.
إخلاء المسؤولية
لا يُقصد بالمعلومات والمنشورات أن تكون، أو تشكل، أي نصيحة مالية أو استثمارية أو تجارية أو أنواع أخرى من النصائح أو التوصيات المقدمة أو المعتمدة من TradingView. اقرأ المزيد في شروط الاستخدام.