📊 1. Price Action Breakdown
✅ Breakout Confirmed:
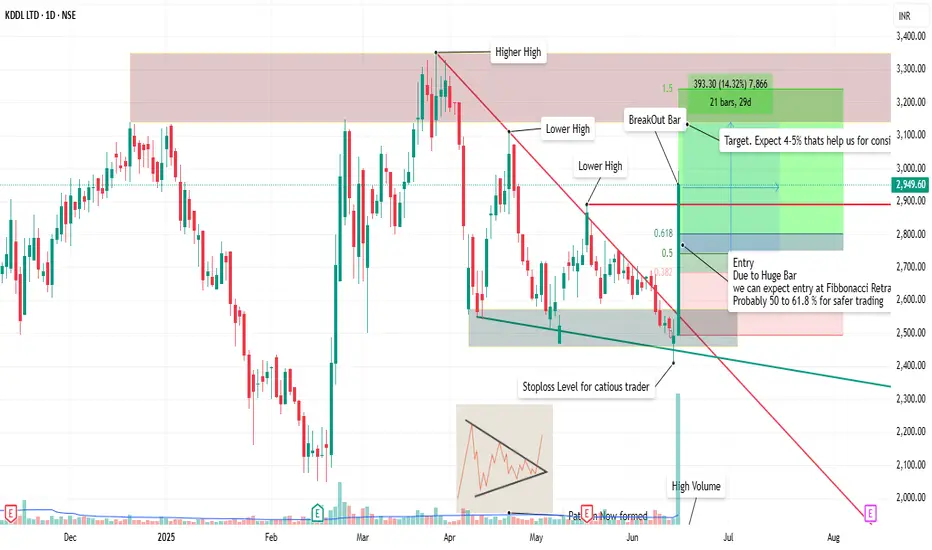
Clear breakout from a descending triangle/consolidation pattern, backed by high volume.
Broke past multiple lower highs and trendline resistance.
📈 Structure:
Formed higher low support near ₹2,350–₹2,400 zone.
Breakout bar was wide-range and on extreme volume — a sign of institutional participation.
🔁 Entry Strategy:
Ideal entries lie in the Fibonacci retracement zone (38.2%–61.8%), roughly ₹2,650–₹2,750, if the price pulls back.
Safer for swing traders to wait for that zone.
🎯 Target Zone:
₹3,250–₹3,350 range (based on measured move and previous resistance).
This offers a 14%+ move, but as per our plan, aiming for 4–5% consistent profit is wise.
📦 2. Volume Analysis
High Volume Spike on breakout bar = strong confirmation.
Prior to breakout, volume was compressing — classic coiling pattern behavior before explosive move.
🧭 3. Stage Classification
✅ Current Stage: Stage 2 – Early Markup Phase
Reasons:
Breaking out from a long correction/consolidation.
High-volume confirmation.
Higher lows and breakout from downtrend.
Clear resistance zones above, making it a trending candidate.
🧯 4. Trade Plan Summary
Metric Value
📌 Entry Range ₹2,650–₹2,750 (Fibonacci zone)
🧯 Stop Loss ₹2,400–₹2,450
📈 Target 1 ₹3,100–₹3,200
📈 Target 2 (Positional) ₹3,300–₹3,350
💡 Reward:Risk 1:2+ potential if managed well
✅ Conclusion
KDDL Ltd is in a Stage 2 breakout phase, with a textbook setup:
Strong volume breakout
Pullback expected
Defined entry and SL zones
✅ Breakout Confirmed:
Clear breakout from a descending triangle/consolidation pattern, backed by high volume.
Broke past multiple lower highs and trendline resistance.
📈 Structure:
Formed higher low support near ₹2,350–₹2,400 zone.
Breakout bar was wide-range and on extreme volume — a sign of institutional participation.
🔁 Entry Strategy:
Ideal entries lie in the Fibonacci retracement zone (38.2%–61.8%), roughly ₹2,650–₹2,750, if the price pulls back.
Safer for swing traders to wait for that zone.
🎯 Target Zone:
₹3,250–₹3,350 range (based on measured move and previous resistance).
This offers a 14%+ move, but as per our plan, aiming for 4–5% consistent profit is wise.
📦 2. Volume Analysis
High Volume Spike on breakout bar = strong confirmation.
Prior to breakout, volume was compressing — classic coiling pattern behavior before explosive move.
🧭 3. Stage Classification
✅ Current Stage: Stage 2 – Early Markup Phase
Reasons:
Breaking out from a long correction/consolidation.
High-volume confirmation.
Higher lows and breakout from downtrend.
Clear resistance zones above, making it a trending candidate.
🧯 4. Trade Plan Summary
Metric Value
📌 Entry Range ₹2,650–₹2,750 (Fibonacci zone)
🧯 Stop Loss ₹2,400–₹2,450
📈 Target 1 ₹3,100–₹3,200
📈 Target 2 (Positional) ₹3,300–₹3,350
💡 Reward:Risk 1:2+ potential if managed well
✅ Conclusion
KDDL Ltd is in a Stage 2 breakout phase, with a textbook setup:
Strong volume breakout
Pullback expected
Defined entry and SL zones
ملاحظة
cautious typoمنشورات ذات صلة
إخلاء المسؤولية
لا يُقصد بالمعلومات والمنشورات أن تكون، أو تشكل، أي نصيحة مالية أو استثمارية أو تجارية أو أنواع أخرى من النصائح أو التوصيات المقدمة أو المعتمدة من TradingView. اقرأ المزيد في شروط الاستخدام.
منشورات ذات صلة
إخلاء المسؤولية
لا يُقصد بالمعلومات والمنشورات أن تكون، أو تشكل، أي نصيحة مالية أو استثمارية أو تجارية أو أنواع أخرى من النصائح أو التوصيات المقدمة أو المعتمدة من TradingView. اقرأ المزيد في شروط الاستخدام.