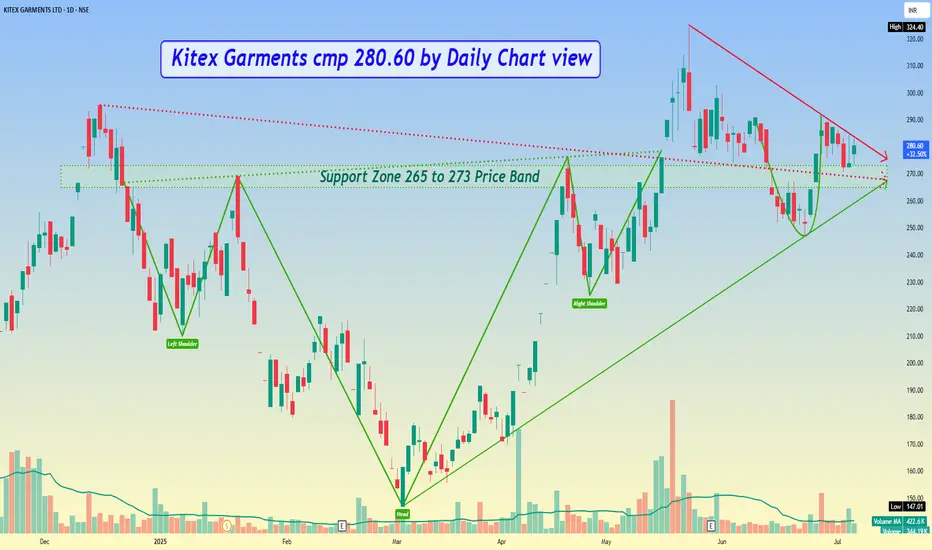
Kitex Garments cmp 280.60 by Daily Chart view
- Support Zone 265 to 273 Price Band
- Resistance Zone 287 to 294 Price Band
- Bullish Head & Shoulders formed with Support Zone neckline
- Volumes seen spiking up at regular intervals above avg traded quantity
- Support Zone been tested retested over past few days, anticipating upside breakout
- Rising Support Trendline respected plus Falling Resistance Trendline Breakout attempted
- Majority of the Technical Indicators BB, EMA, MACD, RSI seen getting in a positive trend mode
إخلاء المسؤولية
لا يُقصد بالمعلومات والمنشورات أن تكون، أو تشكل، أي نصيحة مالية أو استثمارية أو تجارية أو أنواع أخرى من النصائح أو التوصيات المقدمة أو المعتمدة من TradingView. اقرأ المزيد في شروط الاستخدام.
إخلاء المسؤولية
لا يُقصد بالمعلومات والمنشورات أن تكون، أو تشكل، أي نصيحة مالية أو استثمارية أو تجارية أو أنواع أخرى من النصائح أو التوصيات المقدمة أو المعتمدة من TradingView. اقرأ المزيد في شروط الاستخدام.