KSE 100 Index Analysis |By The Chart Alchemist | 30-Min TF | 13-Oct-2025
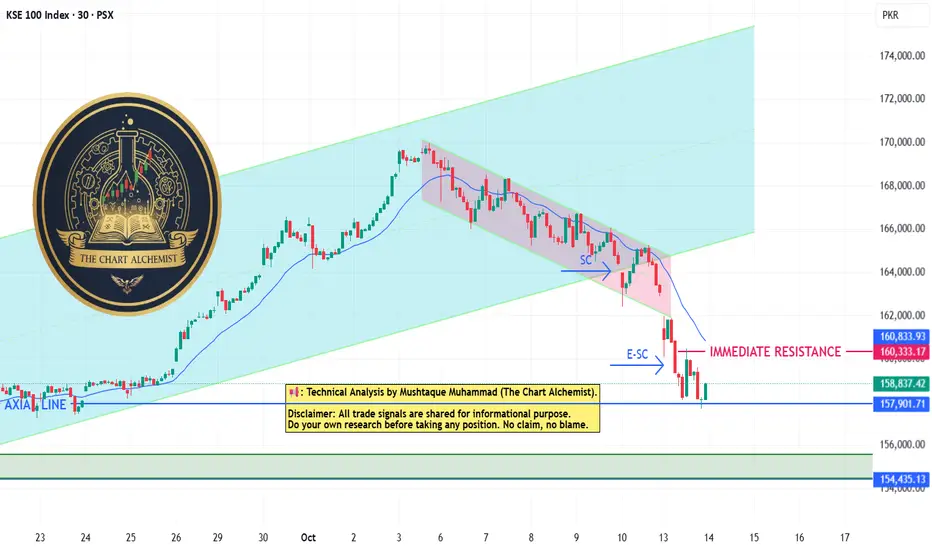
The KSE 100 index previously traded in a bullish channel (marked light blue) before reversing after reaching an all-time high of 170,000 points. The subsequent correction entered a bearish mode, initially within a channel that included multiple selling climaxes. A parabolic breakdown from this channel ensued, marked by exhaustive selling.
The index is currently finding support at 157,900 points (Axial Line). While it has shown an upward reversal, confirmation of the bearish correction's end and resumption of the uptrend requires:
1. A move above the immediate resistance line (160,340 points, marked solid color).
2. Formation of a higher low.
Until these conditions are met, caution is advised.
إخلاء المسؤولية
لا يُقصد بالمعلومات والمنشورات أن تكون، أو تشكل، أي نصيحة مالية أو استثمارية أو تجارية أو أنواع أخرى من النصائح أو التوصيات المقدمة أو المعتمدة من TradingView. اقرأ المزيد في شروط الاستخدام.
إخلاء المسؤولية
لا يُقصد بالمعلومات والمنشورات أن تكون، أو تشكل، أي نصيحة مالية أو استثمارية أو تجارية أو أنواع أخرى من النصائح أو التوصيات المقدمة أو المعتمدة من TradingView. اقرأ المزيد في شروط الاستخدام.