📈 LIFE INSURANCE CORPORATION OF INDIA (LICI) – TECHNICAL ANALYSIS
📆 Date: May 28, 2025
🔍 Timeframe: Daily
________________________________________
Price Action:
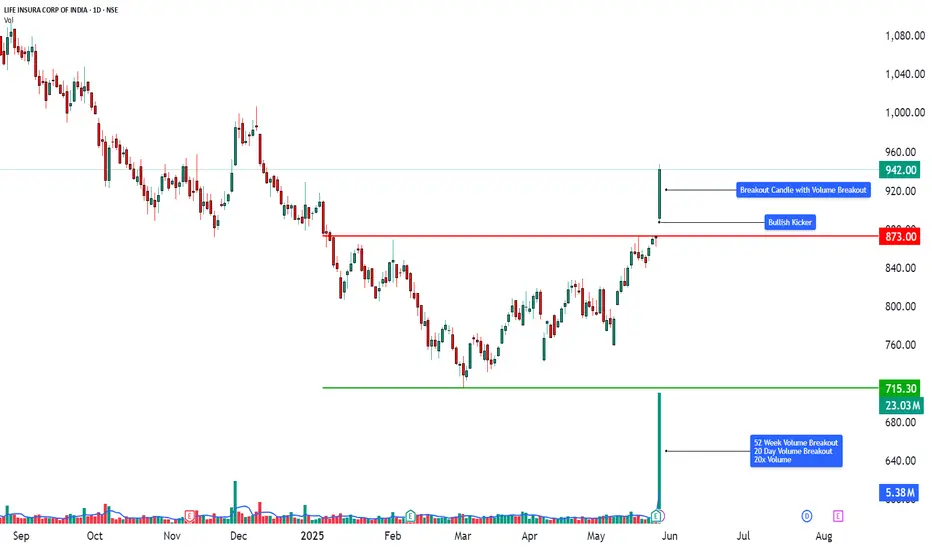
LICI surged over 8.12% in today’s session, registering a breakout after weeks of sideways consolidation. The breakout candle was wide-bodied, closing near the day’s high, and supported by a 20-day volume breakout – signaling fresh bullish momentum and accumulation at lower levels.
________________________________________
Chart Pattern / Candlestick Pattern:
• Sideways Consolidation Breakout
• Strong Bullish Candle (Buy Today, Sell Tomorrow setup)
• 52-Week Volume Breakout
• RSI Breakout
• BB Squeeze Exit – Volatility Expansion Phase
• Bollinger Band Expansion + Momentum Surge
• Multiple bullish candlestick patterns across all timeframes = multi-frame trend alignment.
• Gap-Up + Kicker + Long White Candle combo increases conviction of momentum breakout.
• Heikin Ashi continuity indicates a trend in motion without signs of reversal.
________________________________________
Technical Indicators:
• RSI (Daily): 79 – Bullish territory
• MACD: Bullish crossover active
• Stochastic: 97 – Overbought but confirms momentum
• CCI: 206 – Strong upside acceleration
• Volume: 23.03M – Very high vs. 2.24M average, confirms breakout
________________________________________
Support & Resistance Levels:
• Immediate Resistance: ₹964
• Next Resistance: ₹986
• Major Resistance: ₹1024
• Immediate Support: ₹904
• Secondary Support: ₹866
• Major Support: ₹844
• Weak Support Zone: ₹760–₹720
________________________________________
Chart Overview:
This visual representation highlights:
🔸 Clear resistance break with powerful volume
🔸 Bullish momentum confirmed by multiple indicators
🔸 20-day volume breakout indicating accumulation
🔸 Layered resistance levels between ₹964–₹1024
🔸 Tight squeeze breakout offering high R:R setups
________________________________________
Educational Breakdown:
This trade setup showcases:
• Breakout Confirmation: Price + Volume + Momentum Alignment
• Band Expansion: Beginning of volatility trend
• Momentum Shift: From sideways to bullish trend
• Volume Behavior: Institutional interest clearly visible
• Support Layering: Gives fallback levels for pullback traders
Such a chart is a perfect case study in breakout trading, especially post-consolidation and on high volume days.
________________________________________
How to Trade LICI (for learning purpose):
• Entry Example: ₹942.00
• Stop Loss: ₹844.00 (Risk: ₹98.00)
• Target 1: ₹964.00 (Reward: ₹22.00)
• Target 2: ₹986.00 (Reward: ₹44.00)
• Target 3: ₹1024.00 (Reward: ₹82.00)
• Sample Quantity: 50 shares
• RR Ratio: Short-term ~1:0.5; Swing ~1:1 or more
• Aggressive Traders: Can trail stop-loss as price approaches ₹986
• Conservative Traders: Wait for dip toward ₹904 or ₹866 zones
________________________________________
This breakout setup is ideal for swing trades, backed by strong volume and momentum indicators. However, since the RSI and Stochastic are in the overbought zone, traders should manage risk through stop-losses or wait for minor retracements for safer entries.
⚠️ Risk Management Tip: Always trade with a clearly defined stop loss. Avoid entering positions impulsively. It is advisable to start with a smaller quantity and increase your exposure only if the price action confirms the continuation of the trend. Capital protection should always be the priority.
📢 Disclaimer
This content is created purely for educational and informational purposes. It is not intended as investment advice, stock recommendations, or trading tips. Trading and investing in the stock market involves risk. Please consult with a SEBI-registered financial advisor before making any investment decisions. The author/creator is not registered with SEBI and shall not be held responsible for any losses incurred based on this information. Always do your own research and use proper risk management.
👉 If you found this analysis helpful, don’t forget to Follow, so you never miss out on a trade-worthy setup, breakout opportunity, or valuable educational insight again. Stay updated and trade smarter! 💡📈
📆 Date: May 28, 2025
🔍 Timeframe: Daily
________________________________________
Price Action:
LICI surged over 8.12% in today’s session, registering a breakout after weeks of sideways consolidation. The breakout candle was wide-bodied, closing near the day’s high, and supported by a 20-day volume breakout – signaling fresh bullish momentum and accumulation at lower levels.
________________________________________
Chart Pattern / Candlestick Pattern:
• Sideways Consolidation Breakout
• Strong Bullish Candle (Buy Today, Sell Tomorrow setup)
• 52-Week Volume Breakout
• RSI Breakout
• BB Squeeze Exit – Volatility Expansion Phase
• Bollinger Band Expansion + Momentum Surge
• Multiple bullish candlestick patterns across all timeframes = multi-frame trend alignment.
• Gap-Up + Kicker + Long White Candle combo increases conviction of momentum breakout.
• Heikin Ashi continuity indicates a trend in motion without signs of reversal.
________________________________________
Technical Indicators:
• RSI (Daily): 79 – Bullish territory
• MACD: Bullish crossover active
• Stochastic: 97 – Overbought but confirms momentum
• CCI: 206 – Strong upside acceleration
• Volume: 23.03M – Very high vs. 2.24M average, confirms breakout
________________________________________
Support & Resistance Levels:
• Immediate Resistance: ₹964
• Next Resistance: ₹986
• Major Resistance: ₹1024
• Immediate Support: ₹904
• Secondary Support: ₹866
• Major Support: ₹844
• Weak Support Zone: ₹760–₹720
________________________________________
Chart Overview:
This visual representation highlights:
🔸 Clear resistance break with powerful volume
🔸 Bullish momentum confirmed by multiple indicators
🔸 20-day volume breakout indicating accumulation
🔸 Layered resistance levels between ₹964–₹1024
🔸 Tight squeeze breakout offering high R:R setups
________________________________________
Educational Breakdown:
This trade setup showcases:
• Breakout Confirmation: Price + Volume + Momentum Alignment
• Band Expansion: Beginning of volatility trend
• Momentum Shift: From sideways to bullish trend
• Volume Behavior: Institutional interest clearly visible
• Support Layering: Gives fallback levels for pullback traders
Such a chart is a perfect case study in breakout trading, especially post-consolidation and on high volume days.
________________________________________
How to Trade LICI (for learning purpose):
• Entry Example: ₹942.00
• Stop Loss: ₹844.00 (Risk: ₹98.00)
• Target 1: ₹964.00 (Reward: ₹22.00)
• Target 2: ₹986.00 (Reward: ₹44.00)
• Target 3: ₹1024.00 (Reward: ₹82.00)
• Sample Quantity: 50 shares
• RR Ratio: Short-term ~1:0.5; Swing ~1:1 or more
• Aggressive Traders: Can trail stop-loss as price approaches ₹986
• Conservative Traders: Wait for dip toward ₹904 or ₹866 zones
________________________________________
This breakout setup is ideal for swing trades, backed by strong volume and momentum indicators. However, since the RSI and Stochastic are in the overbought zone, traders should manage risk through stop-losses or wait for minor retracements for safer entries.
⚠️ Risk Management Tip: Always trade with a clearly defined stop loss. Avoid entering positions impulsively. It is advisable to start with a smaller quantity and increase your exposure only if the price action confirms the continuation of the trend. Capital protection should always be the priority.
📢 Disclaimer
This content is created purely for educational and informational purposes. It is not intended as investment advice, stock recommendations, or trading tips. Trading and investing in the stock market involves risk. Please consult with a SEBI-registered financial advisor before making any investment decisions. The author/creator is not registered with SEBI and shall not be held responsible for any losses incurred based on this information. Always do your own research and use proper risk management.
👉 If you found this analysis helpful, don’t forget to Follow, so you never miss out on a trade-worthy setup, breakout opportunity, or valuable educational insight again. Stay updated and trade smarter! 💡📈
STWP | Mentor & Demand-Supply Specialist | Empowering traders through structured learning |
simpletradewithpatience.com
Community: chat.whatsapp.com/BEYz0tkqP0fJPBCWf59uel
wa.me/message/6IOPHGOXMGZ4N1
Educational Only
simpletradewithpatience.com
Community: chat.whatsapp.com/BEYz0tkqP0fJPBCWf59uel
wa.me/message/6IOPHGOXMGZ4N1
Educational Only
إخلاء المسؤولية
لا يُقصد بالمعلومات والمنشورات أن تكون، أو تشكل، أي نصيحة مالية أو استثمارية أو تجارية أو أنواع أخرى من النصائح أو التوصيات المقدمة أو المعتمدة من TradingView. اقرأ المزيد في شروط الاستخدام.