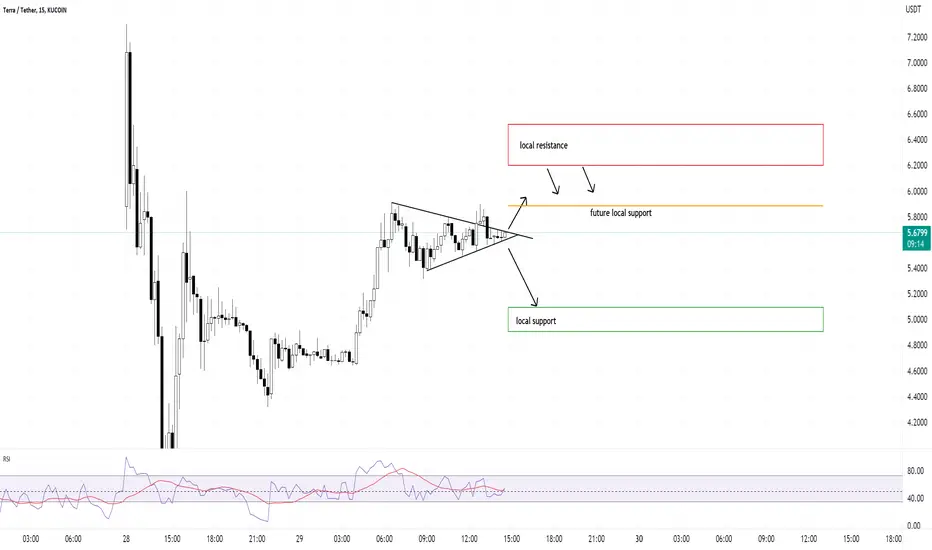
We are in a triangular formation which is neutral indicator. If the price had a bullish phase, there is a possibility of continuation. If the price rises, the highlighted resistance zone should be where most sell orders are sitting.
*** WARNING : Luna is extremely volatile at the moment, and yeah it might even go way past $6 up to $20, but the reverse is also possible.****
If it behaves well when the price starts going lower, then the local support zone is highlighted in green. There should be a big volume there, which should help price stabilize or get back up.
TLDR: Can go either way really fast
ملاحظة
resistance area hit! will post a new chartتم حذف الأمر
Guys I don't know what happened, but the chart is broken on my screen, it won't load properly. So I am abandoning this postإخلاء المسؤولية
لا يُقصد بالمعلومات والمنشورات أن تكون، أو تشكل، أي نصيحة مالية أو استثمارية أو تجارية أو أنواع أخرى من النصائح أو التوصيات المقدمة أو المعتمدة من TradingView. اقرأ المزيد في شروط الاستخدام.
إخلاء المسؤولية
لا يُقصد بالمعلومات والمنشورات أن تكون، أو تشكل، أي نصيحة مالية أو استثمارية أو تجارية أو أنواع أخرى من النصائح أو التوصيات المقدمة أو المعتمدة من TradingView. اقرأ المزيد في شروط الاستخدام.