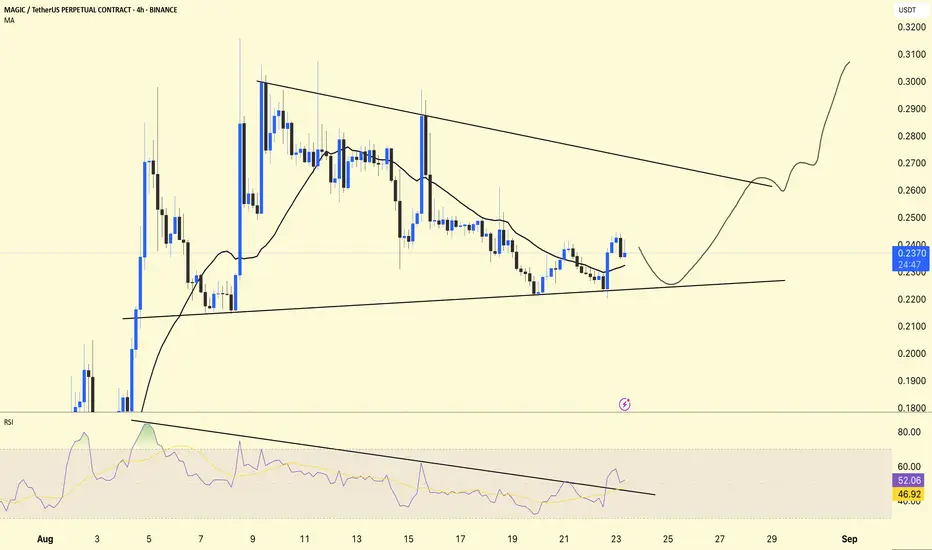
MAGIC is currently trading at $0.2376, showing a falling wedge structure with RSI breakout confirmation.
📊 Chart Overview:
Falling Wedge Pattern
The price is consolidating between a lower high and a higher low.
If it breaks to the upside, it is a bullish reversal pattern.
Support Area
Strong support (trendline support) near $0.22–0.225.
As long as this level holds, downside looks limited.
RSI Indicator
RSI = 52.64, above its MA (46.96).
RSI broke its downtrend line → early sign of bullish momentum building.
Moving Average (MA 25)
The price is slightly above the moving average (0.2324), which is a sign of short-term correction.
DYOR | NFA
منشورات ذات صلة
إخلاء المسؤولية
لا يُقصد بالمعلومات والمنشورات أن تكون، أو تشكل، أي نصيحة مالية أو استثمارية أو تجارية أو أنواع أخرى من النصائح أو التوصيات المقدمة أو المعتمدة من TradingView. اقرأ المزيد في شروط الاستخدام.
منشورات ذات صلة
إخلاء المسؤولية
لا يُقصد بالمعلومات والمنشورات أن تكون، أو تشكل، أي نصيحة مالية أو استثمارية أو تجارية أو أنواع أخرى من النصائح أو التوصيات المقدمة أو المعتمدة من TradingView. اقرأ المزيد في شروط الاستخدام.