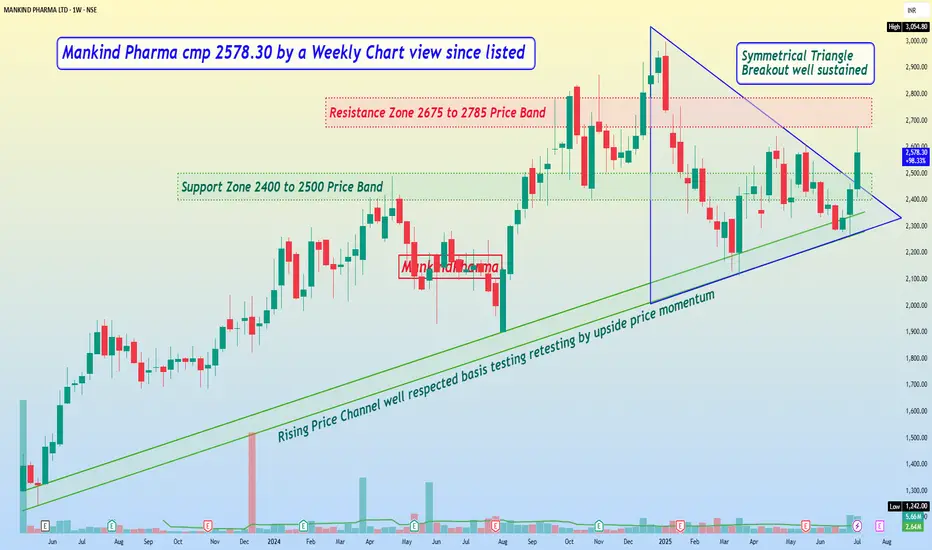
Mankind Pharma cmp 2578.30 by a Weekly Chart view since listed
- Support Zone 2400 to 2500 Price Band
- Resistance Zone 2675 to 2785 Price Band
- Symmetrical Triangle Breakout well sustained
- Back to back Bullish Rounding Bottom with Resistance Zone neckline
- Most common Technical Indicators BB, EMA, SAR, MACD, RSI turning positive
- Good Volumes increase, well above avg traded quantity by demand based buying
- Rising Price Channel well respected basis testing retesting by upside price momentum
إخلاء المسؤولية
لا يُقصد بالمعلومات والمنشورات أن تكون، أو تشكل، أي نصيحة مالية أو استثمارية أو تجارية أو أنواع أخرى من النصائح أو التوصيات المقدمة أو المعتمدة من TradingView. اقرأ المزيد في شروط الاستخدام.
إخلاء المسؤولية
لا يُقصد بالمعلومات والمنشورات أن تكون، أو تشكل، أي نصيحة مالية أو استثمارية أو تجارية أو أنواع أخرى من النصائح أو التوصيات المقدمة أو المعتمدة من TradingView. اقرأ المزيد في شروط الاستخدام.