MATIC on 4H interval, target and stop loss
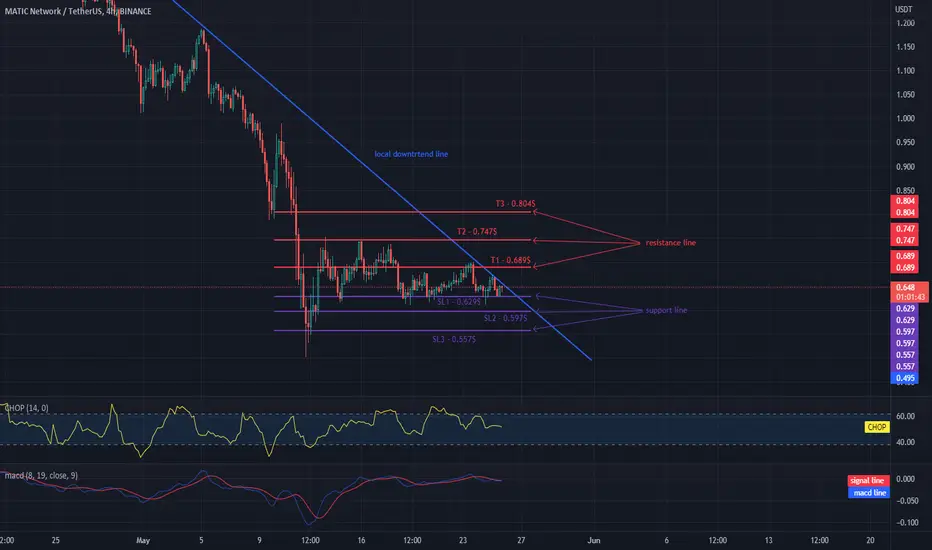
Hello everyone, let's take a look at the MATIC to USDT chart over the 4 hour timeframe. As you can see, the price is moving below the local downtrend line.
Let's start with determining the stop loss that we should take into account in the short term and, as you can see, we can set the following stop loss:
SL1 - $ 0.629
SL2 - $ 0.597
SL3 - $ 0.557
Now it is worth going to the targets that we should take into account when playing short-term, we see individual targets:
T1 - $ 0.689
T2 - $ 0.747
T3 - $ 0.804
Looking at the CHOP indicator we can see that in the 4-hour interval some energy has been used up, but we have a little bit to continue the movement.
However, please remember that the market can be dynamic and you should always be careful with the market and analysis.
إخلاء المسؤولية
لا يُقصد بالمعلومات والمنشورات أن تكون، أو تشكل، أي نصيحة مالية أو استثمارية أو تجارية أو أنواع أخرى من النصائح أو التوصيات المقدمة أو المعتمدة من TradingView. اقرأ المزيد في شروط الاستخدام.
إخلاء المسؤولية
لا يُقصد بالمعلومات والمنشورات أن تكون، أو تشكل، أي نصيحة مالية أو استثمارية أو تجارية أو أنواع أخرى من النصائح أو التوصيات المقدمة أو المعتمدة من TradingView. اقرأ المزيد في شروط الاستخدام.