________________________________________________________________________________
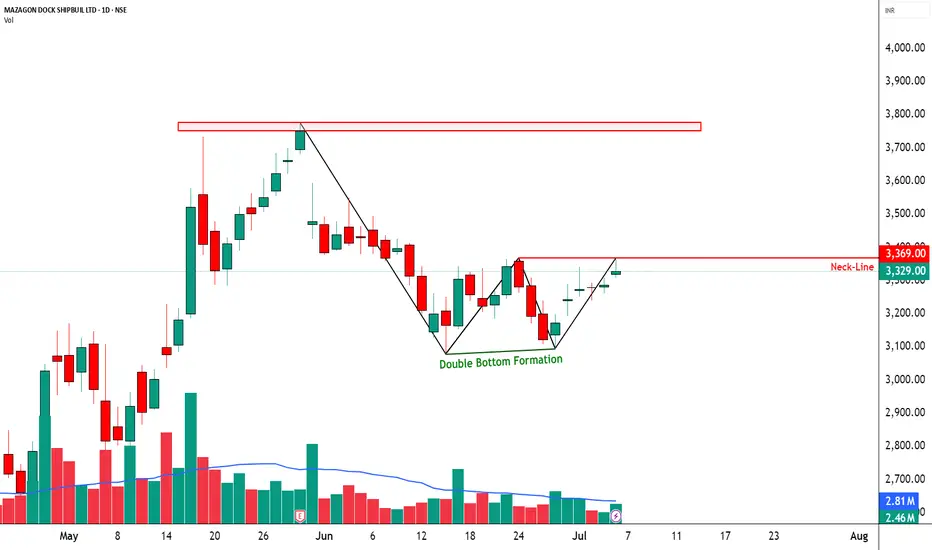
📈 MAZDOCK – TECHNICAL ANALYSIS
📆 Date: July 4, 2025 | ⏱ Timeframe: Daily Chart
🔍 Educational Breakdown – For Learning & Study Use Only
________________________________________________________________________________
🔹 Price Action Zones
• 🔴 Top Range: 3775
• Resistance: 3362 – 3396 – 3423
• 🟢 Bottom Range: 3077.7
• Support: 3241 – 3274 – 3301
________________________________________________________________________________
🔹 Chart Pattern: ✅ W-Bottom Formation
A clean W-shaped reversal pattern is forming. Price is respecting demand zones and gradually forming higher lows. Neckline lies around 3369 — breakout above this may fuel further upside.
________________________________________________________________________________
🔹 Reversal Candlestick Patterns:
⛔ No major reversal candle on 4th July 2025.
________________________________________________________________________________
🔹 Volume Footprint:
✅ Gradual volume pickup
🚨 Watch for breakout above 3362–3396 with volume >3.5M
🔼 A successful breakout may trigger a swift move toward 3425–3520.
________________________________________________________________________________
🔹 Trend Bias: ✅ Bullish
Short-term momentum favors the bulls with sectoral tailwinds from PSU + Defense themes.
________________________________________________________________________________
📌 What’s Catching Our Eye:
• W-Bottom Pattern nearing breakout
• Price reclaimed key demand zone and consolidating just below resistance
• PSU + Defense theme rally adds sector momentum
________________________________________________________________________________
👀 What We’re Watching For:
• Breakout Confirmation: Daily close above 3396 with 3.5M+ volume
• Pullback Re-entry: Ideal zone 3300–3310 for fresh entries
• Volume Spike: Key trigger for breakout validation
________________________________________________________________________________
⚠️ Risks to Watch:
• Low volume breakout = Bull trap risk
• Sector rotation or sudden weakness in PSU/Defense
• Breakdown below 3240 = pattern failure & shift in bias
________________________________________________________________________________
🔮 What to Expect Next:
• ⚡ Retest of 3362–3396 range likely
• 🔄 Minor consolidation / handle formation possible
• 🔄 Watch for volatility near resistance (intraday fakeouts)
________________________________________________________________________________
📊 Trade Plan (Based on Logic + Volume Confirmation)
🔼 Breakout Long Setup:
• Entry: Above 3369
• Stop Loss: 3300
• Risk–Reward: ~1:1 to 1:2
📌 Why:
• W-bottom breakout
• Sector strength + price structure alignment
• Volume >3.5M is the key trigger
________________________________________________________________________________
🔁 Pullback Long Setup:
• Entry Zone: 3305–3310
• Stop Loss: 3240 (Support 3)
• Risk–Reward: ~1:1 to 1:2
📌 Why:
• Tight SL near structure
• Good risk-reward for early entry
________________________________________________________________________________
🔽 Bearish Setup (Rejection from Resistance):
• Entry: Below 3300
• Stop Loss: Above 3365
• Risk–Reward: ~Flexible — as per individual trader's strategy and risk appetite
📌 Why:
• Rejection from neckline
• Low-volume breakout = trap
• Breakdown below support shifts structure to bearish
________________________________________________________________________________
❌ Invalidation Triggers:
• Daily Close below 3240
• Bearish Marubozu with volume = shift to supply pressure
________________________________________________________________________________
📌 Intraday Supply Zones Noted (15-Min Chart):
The 15-minute chart reveals the presence of multiple intraday supply zones, indicating short-term selling pressure.
🟥 Tested Supply Zone: 3337.30 – 3346.30 | SL: 3352.20
🟥 Strong Supply Zone: 3349.40 – 3358.60 | SL: 3364.50
These zones may act as resistance levels for intraday traders. Watch for price rejection or confirmation candles in these areas before planning any breakout trades.
________________________________________________________________________________
⚠️ Disclaimer:
This analysis is for educational purposes only.
STWP is not a SEBI-registered advisor.
No buy/sell recommendations are made.
Please consult your financial advisor before trading.
STWP is not responsible for trading decisions based on this post.
________________________________________________________________________________
💬 Found this helpful?
Have you caught this W-pattern early?
Share your thoughts in the comments ⬇️
🔁 Spread the insight with fellow traders
✅ Follow STWP for smart technical setups backed by volume and price action
🚀 Let’s trade with patience, logic, and clarity!
Be Self-Reliant | Trade with Patience | Learn with Logic
________________________________________________________________________________
STWP | Mentor & Demand-Supply Specialist | Empowering traders through structured learning |
simpletradewithpatience.com
Community: chat.whatsapp.com/BEYz0tkqP0fJPBCWf59uel
wa.me/message/6IOPHGOXMGZ4N1
Educational Only
simpletradewithpatience.com
Community: chat.whatsapp.com/BEYz0tkqP0fJPBCWf59uel
wa.me/message/6IOPHGOXMGZ4N1
Educational Only
إخلاء المسؤولية
The information and publications are not meant to be, and do not constitute, financial, investment, trading, or other types of advice or recommendations supplied or endorsed by TradingView. Read more in the Terms of Use.