Bullish for the midterm/longterm...
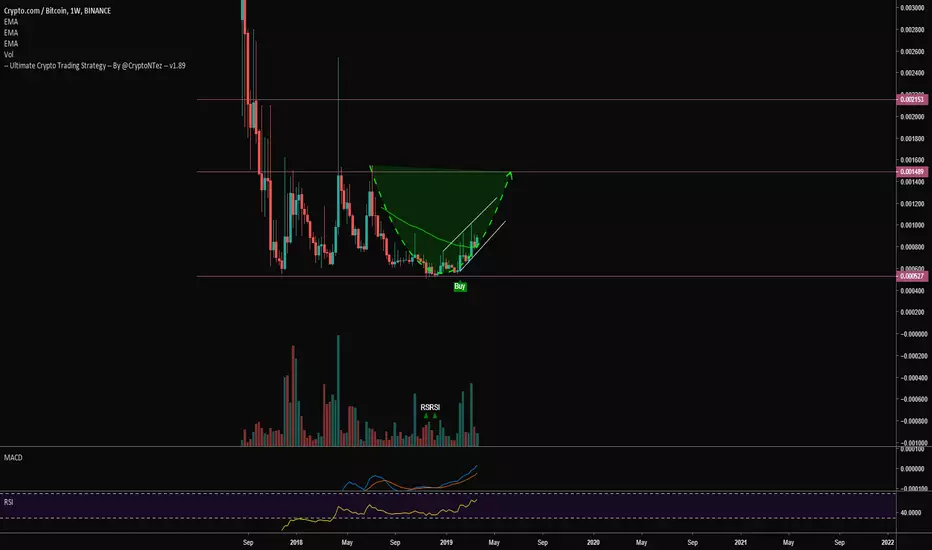
Looking at the weekly chart we can see a recurrent pattern(3 executions) from botton to top (500-1500sats)..
I think we can be running a 4th iteration with a slower pace
Notice the UCTS buy signal (STRONG SIGNAL)
Also Volume is at really high lvls.
Moving into 2D chart...
Price crossing EMA200 which is a bullish signal, Both MACD & RSI rising with RSI near Overbought levels...
Holding the ascending trend line is key to sustain the movement..
Buying here after a 60% run sounds risky but think about long term possibilities...
UCTS Indicator? Get a 10 days FREE trial at Cryptontez.com
Improve your Crypto Trading with 3commas. 3commas.io/?c=Cryptontez
Telegram Group: t.me/CryptontezTA
Improve your Crypto Trading with 3commas. 3commas.io/?c=Cryptontez
Telegram Group: t.me/CryptontezTA
إخلاء المسؤولية
لا يُقصد بالمعلومات والمنشورات أن تكون، أو تشكل، أي نصيحة مالية أو استثمارية أو تجارية أو أنواع أخرى من النصائح أو التوصيات المقدمة أو المعتمدة من TradingView. اقرأ المزيد في شروط الاستخدام.