🔎 Overview
____________________________________________________________
📔 Concept
____________________________________________________________
📌 How to Use
____________________________________________________________
📊 Chart Explanation
____________________________________________________________
👀 Observation
____________________________________________________________
💡 Conclusion
___________________________________________________________
⚠️ Disclaimer
The Bearish Engulfing Pattern is a strong two-candle reversal formation that signals a potential shift from an uptrend to a downtrend.
It occurs when a small bullish (green) candle is immediately followed by a large bearish (red) candle that completely engulfs the prior candle’s body.
This shows a clear shift in market psychology — buyers initially push the price higher, but sellers step in with force and erase those gains, marking the start of bearish momentum.
____________________________________________________________
📔 Concept
A Bearish Engulfing occurs when:
1️⃣ The first candle is a small green candle continuing the uptrend.
2️⃣ The next candle is a large red candle whose body completely engulfs the green candle’s body.
3️⃣ This pattern signals that sellers have regained control after buyer exhaustion.
____________________________________________________________
📌 How to Use
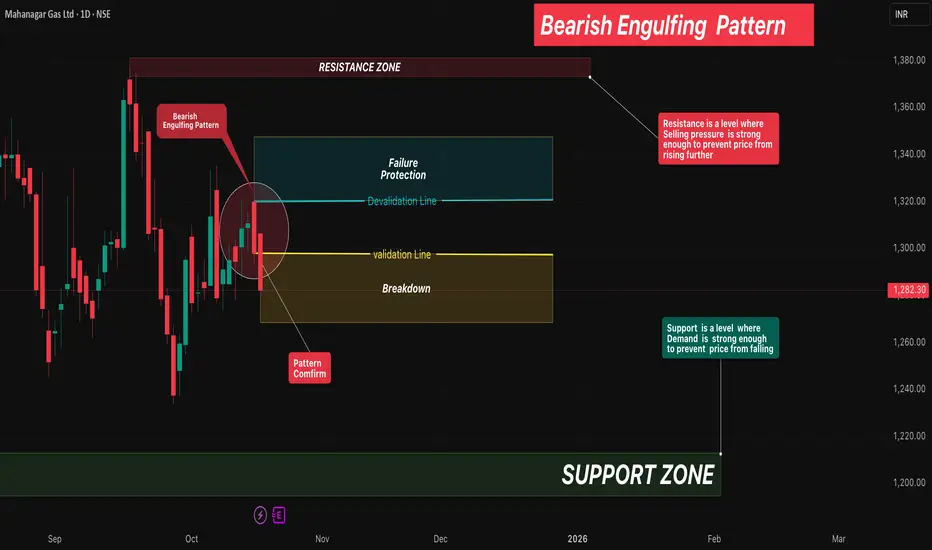
✅ Validation → The candle must close below the open of the red candle to confirm bearish reversal.
❌ Devalidation → If price closes above the close of the red candle before validation, the signal fails.
This structured confirmation helps filter false breakouts and define clear risk levels.
____________________________________________________________
📊 Chart Explanation
• Symbol →MGL
• Timeframe → 1D
• On 15 Oct 2025, a small green candle formed, continuing the uptrend.
• On 16 Oct 2025, a large red candle engulfed the previous green body — confirming the Bearish Engulfing Pattern.
• On 17 Oct 2025, price broke down further, validating the bearish reversal.
This sequence highlights how quickly market sentiment shifted from bullish to bearish control.
____________________________________________________________
👀 Observation
• The Bearish Engulfing is most reliable near swing highs or resistance zones.
• High volume on the engulfing candle strengthens the reversal signal.
• Combining this pattern with confirmation tools like RSI, Supertrend, or Moving Averages
improves accuracy.
____________________________________________________________
💡 Conclusion
The Bearish Engulfing Pattern marks a clear shift in control from buyers to sellers.
Once validated, it indicates a high-probability reversal setup with defined stop-lose and target zones based on structure or risk-reward multiples.
___________________________________________________________
⚠️ Disclaimer
📘 For educational purposes only.
🙅 Not SEBI registered.
❌ Not a buy/sell recommendation.
🧠 Purely a learning resource.
📊 Not Financial Advice.
إخلاء المسؤولية
لا يُقصد بالمعلومات والمنشورات أن تكون، أو تشكل، أي نصيحة مالية أو استثمارية أو تجارية أو أنواع أخرى من النصائح أو التوصيات المقدمة أو المعتمدة من TradingView. اقرأ المزيد في شروط الاستخدام.
إخلاء المسؤولية
لا يُقصد بالمعلومات والمنشورات أن تكون، أو تشكل، أي نصيحة مالية أو استثمارية أو تجارية أو أنواع أخرى من النصائح أو التوصيات المقدمة أو المعتمدة من TradingView. اقرأ المزيد في شروط الاستخدام.