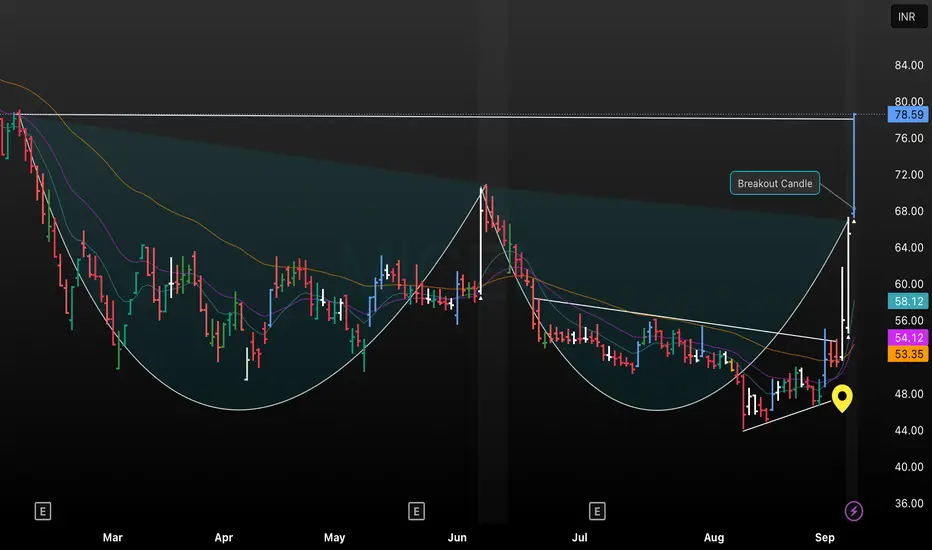
This chart shows the daily price action of MICEL, highlighting a classic cup and handle formation that developed over several months. The highlighted candle marks a strong breakout above the horizontal resistance near ₹78.59, confirming the pattern and signaling bullish momentum. Multiple moving averages are included for added trend analysis; the breakout volume and rapid price move suggest potential for further upside, making this setup significant for momentum traders.
إخلاء المسؤولية
لا يُقصد بالمعلومات والمنشورات أن تكون، أو تشكل، أي نصيحة مالية أو استثمارية أو تجارية أو أنواع أخرى من النصائح أو التوصيات المقدمة أو المعتمدة من TradingView. اقرأ المزيد في شروط الاستخدام.
إخلاء المسؤولية
لا يُقصد بالمعلومات والمنشورات أن تكون، أو تشكل، أي نصيحة مالية أو استثمارية أو تجارية أو أنواع أخرى من النصائح أو التوصيات المقدمة أو المعتمدة من TradingView. اقرأ المزيد في شروط الاستخدام.