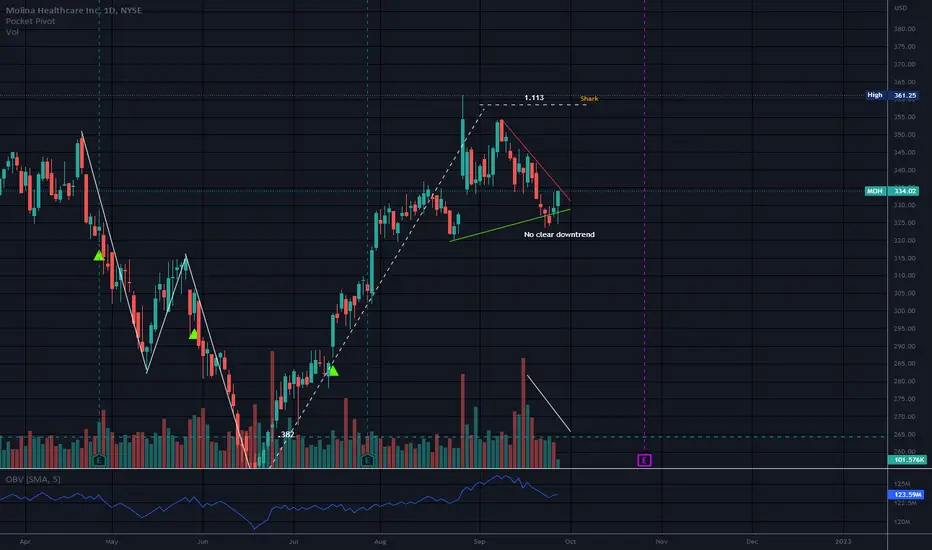
This triangle looked as if it would break to the downside. Now price is back inside the structure but a confirmed downtrend was never established.
This is an example of why it is important to wait for a confirmed downtrend or a confirmed uptrend after the break of a pattern.
Volume declining but this is not unusual in a triangle or a flag pattern.
I do think MOH will go down eventually, but it is almost impossible to know which way this triangle will break.
I learned something new about timing market rallies versus oversold status. The market was very oversold before this bounce so it was a bit obvious it was coming.
But this put/call ratio chart is something I will also look at in the future and I did not know it was on here. This is a Put/Call ratio chart and the ratio is over the bands.

Thank you for the info markrivest (o:
No recommendation
This is an example of why it is important to wait for a confirmed downtrend or a confirmed uptrend after the break of a pattern.
Volume declining but this is not unusual in a triangle or a flag pattern.
I do think MOH will go down eventually, but it is almost impossible to know which way this triangle will break.
I learned something new about timing market rallies versus oversold status. The market was very oversold before this bounce so it was a bit obvious it was coming.
But this put/call ratio chart is something I will also look at in the future and I did not know it was on here. This is a Put/Call ratio chart and the ratio is over the bands.
Thank you for the info markrivest (o:
No recommendation
إخلاء المسؤولية
لا يُقصد بالمعلومات والمنشورات أن تكون، أو تشكل، أي نصيحة مالية أو استثمارية أو تجارية أو أنواع أخرى من النصائح أو التوصيات المقدمة أو المعتمدة من TradingView. اقرأ المزيد في شروط الاستخدام.
إخلاء المسؤولية
لا يُقصد بالمعلومات والمنشورات أن تكون، أو تشكل، أي نصيحة مالية أو استثمارية أو تجارية أو أنواع أخرى من النصائح أو التوصيات المقدمة أو المعتمدة من TradingView. اقرأ المزيد في شروط الاستخدام.