Microsoft remains in a well-defined long-term bullish structure despite the current pullback from the 0.40–0.50 Fibonacci resistance cluster. The recent decline appears corrective in nature and does not signal any structural weakness as long as the stock preserves its main support foundation.
Key Support (Primary Structural Level): 373.22
The level at 373.22 represents the most critical demand zone on the chart.
It marks:
As long as price stays above 373.22, the broader upward cycle remains intact.
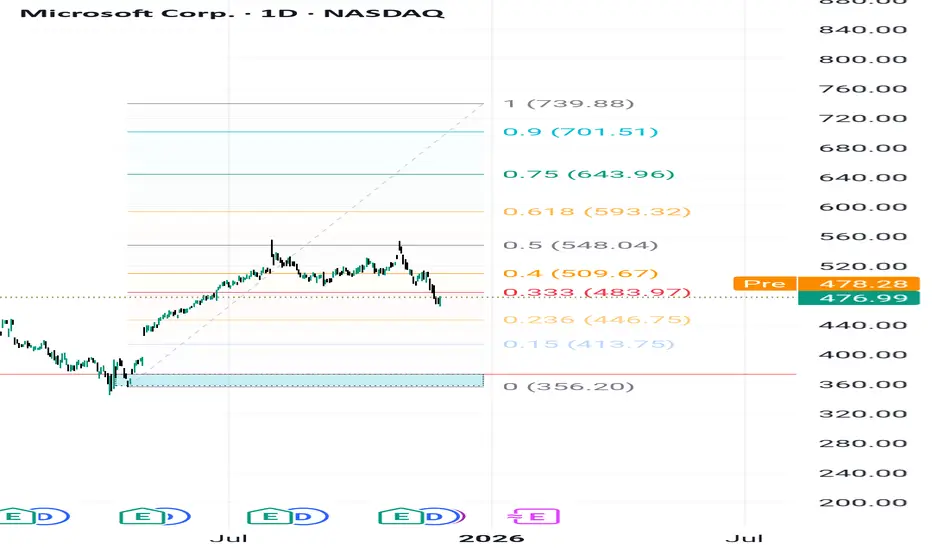
Fibonacci Expansion Targets (Long-Term Investor Levels)
The current impulsive leg projects the following upside targets:
These levels correspond to strategic zones where institutional models anticipate consolidation or profit-taking.
Market Structure & Investor Outlook
The long-term trend remains strongly bullish.
The current pullback is normal retracement behavior.
Secondary demand pockets sit at 446.75 and 413.75 if the pullback deepens.
Macro structure remains fully intact above 373.22.
Bullish Continuation Scenario (Base Case)
If MSFT holds above 483.97 and regains momentum, the price can progress through:
509 → 548 → 593 → 643 → 701 → 739.88
This represents the natural continuation path of the current expansion.
Bearish Scenario (Limited & Non-Structural)
The only valid bearish scenario for now is a return to retest the key support at 373.22.
This move would represent:
As long as price holds 373.22, the long-term bullish structure remains unchanged.
Conclusion
Microsoft continues to demonstrate strong long-term structural integrity.
The only bearish possibility is a corrective move back toward the 373.22 support, after which the broader trend is expected to resume toward the long-term targets: 509, 548, 593, 643, 701, and 739.88.
Key Support (Primary Structural Level): 373.22
The level at 373.22 represents the most critical demand zone on the chart.
It marks:
- The origin of the previous bullish impulse,
- A zone of strong institutional accumulation,
- The base that
As long as price stays above 373.22, the broader upward cycle remains intact.
Fibonacci Expansion Targets (Long-Term Investor Levels)
The current impulsive leg projects the following upside targets:
- 483.97 (0.333)
- 509.67 (0.40)
- 548.04 (0.50)
- 593.32 (0.618)
- 643.96 (0.75)
- 701.51 (0.90)
- 739.88 (1.00 — primary long-term extension)
These levels correspond to strategic zones where institutional models anticipate consolidation or profit-taking.
Market Structure & Investor Outlook
The long-term trend remains strongly bullish.
The current pullback is normal retracement behavior.
Secondary demand pockets sit at 446.75 and 413.75 if the pullback deepens.
Macro structure remains fully intact above 373.22.
Bullish Continuation Scenario (Base Case)
If MSFT holds above 483.97 and regains momentum, the price can progress through:
509 → 548 → 593 → 643 → 701 → 739.88
This represents the natural continuation path of the current expansion.
Bearish Scenario (Limited & Non-Structural)
The only valid bearish scenario for now is a return to retest the key support at 373.22.
This move would represent:
- A technical retest,
- A liquidity sweep,
- A refresh of institutional demand, not a trend reversal
As long as price holds 373.22, the long-term bullish structure remains unchanged.
Conclusion
Microsoft continues to demonstrate strong long-term structural integrity.
The only bearish possibility is a corrective move back toward the 373.22 support, after which the broader trend is expected to resume toward the long-term targets: 509, 548, 593, 643, 701, and 739.88.
إخلاء المسؤولية
The information and publications are not meant to be, and do not constitute, financial, investment, trading, or other types of advice or recommendations supplied or endorsed by TradingView. Read more in the Terms of Use.
إخلاء المسؤولية
The information and publications are not meant to be, and do not constitute, financial, investment, trading, or other types of advice or recommendations supplied or endorsed by TradingView. Read more in the Terms of Use.