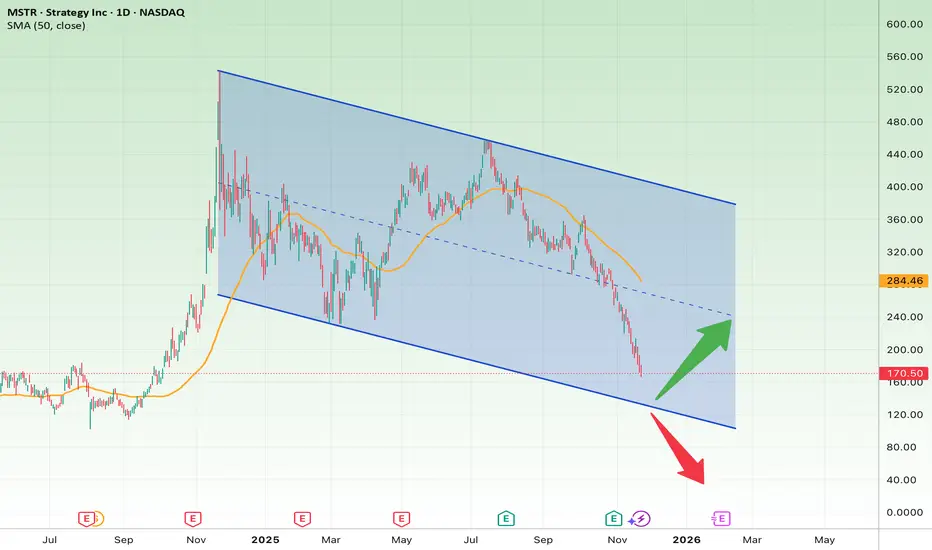
The chart shows MSTR trading inside a large descending channel, with price now approaching the bottom boundary of the channel — a zone where strong reactions usually occur. The recent sell-off has been steep, indicating the stock is potentially oversold at current levels.
1. Key Support (Bottom of Channel)
• Major support: $150 – $160
This is the lower boundary of the descending channel and the most important level on the chart.
2. Bullish Scenario (Green Path)
If MSTR finds support at the bottom of the channel:
• Price may bounce toward the midline of the channel around $230 – $240.
• If momentum continues, the next key resistance is near the 50-day SMA and upper channel resistance at $280 – $300.
3. Bearish Scenario (Red Path)
If price breaks below the channel:
• A sharp decline toward $100 – $120 becomes likely.
• This is the next major support zone below the channel.
Bullish Targets
• TP1: $230
• TP2: $280
• TP3 (extended target): $320
Bearish Target
• TP (Downside): $120
Stop-Loss
• A daily candle closing below $150
This would confirm a breakdown from the channel and invalidate the bullish setup.
إخلاء المسؤولية
لا يُقصد بالمعلومات والمنشورات أن تكون، أو تشكل، أي نصيحة مالية أو استثمارية أو تجارية أو أنواع أخرى من النصائح أو التوصيات المقدمة أو المعتمدة من TradingView. اقرأ المزيد في شروط الاستخدام.
إخلاء المسؤولية
لا يُقصد بالمعلومات والمنشورات أن تكون، أو تشكل، أي نصيحة مالية أو استثمارية أو تجارية أو أنواع أخرى من النصائح أو التوصيات المقدمة أو المعتمدة من TradingView. اقرأ المزيد في شروط الاستخدام.