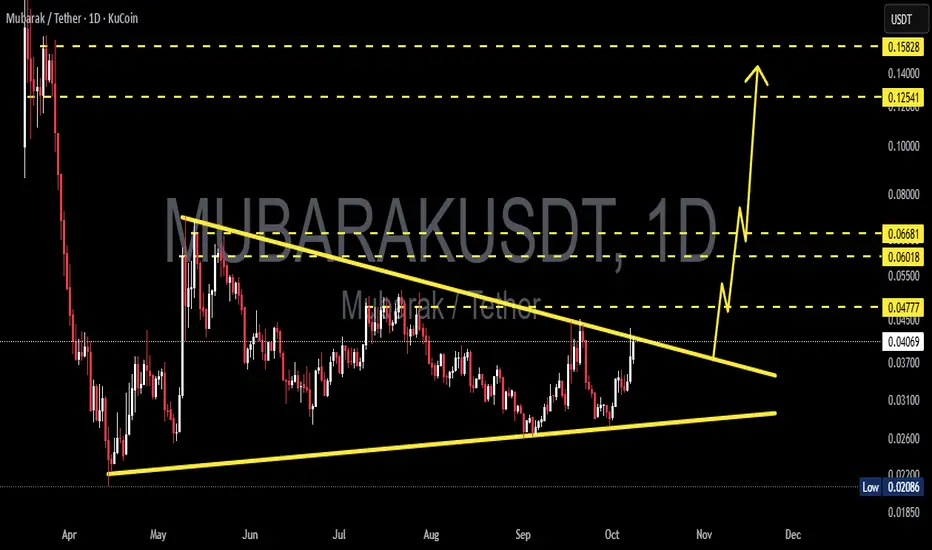
The MUBARAK/USDT pair is approaching a crucial moment as price action compresses inside a Symmetrical Triangle, signaling the market’s tension before a major breakout.
Whenever price reaches the apex of a pattern like this, it often precedes a sharp expansion in volatility — a make-or-break moment for traders.
---
🔶 Pattern Overview & Technical Structure
The Symmetrical Triangle represents a battle of equilibrium between buyers and sellers:
The descending upper trendline keeps pushing lower highs.
The ascending lower trendline protects higher lows.
As both lines converge, energy builds up within the pattern — usually leading to an explosive breakout once one side wins.
Declining volume supports this setup, hinting that a big move is imminent.
---
💹 Key Technical Levels
Current Price: around 0.04050 USDT
Main Resistance: 0.04777 → 0.06018 → 0.06681
Dynamic Support: 0.03100 → 0.02600
Major Support: 0.02086 (historical low)
If a confirmed breakout occurs, the measured move projection from this triangle points toward a potential upside target near 0.086, depending on follow-through and volume confirmation.
---
🚀 Bullish Scenario (Upside Breakout)
Confirmation: A daily candle close above the descending trendline with strong volume.
Continuation: Retest of the breakout zone that turns former resistance into new support.
Upside Targets:
TP1 → 0.04777 (initial resistance)
TP2 → 0.060–0.0668 (supply zone)
TP3 → around 0.086 (measured move projection)
Momentum catalysts — such as surging volume or renewed altcoin rotation — could accelerate this breakout move.
---
⚠️ Bearish Scenario (Rejection / Breakdown)
Confirmation: Strong rejection at upper trendline with long wick and close back below resistance.
Breakdown Trigger: Daily close below the ascending trendline with increasing sell volume.
Downside Targets:
0.026–0.031 (dynamic support zone)
Below that → retest of 0.02086 (historical demand level)
Failure to hold support could spark panic selling, especially given MUBARAK’s relatively low liquidity profile.
---
📊 Momentum Checklist
Watch closely for:
Volume spikes → true breakout confirmation.
Daily close above 0.04777 → bullish validation.
Daily close below 0.03100 → bearish confirmation.
Avoid reacting to intraday wicks — focus on daily candle closes for real signals.
---
🧭 Conclusion & Technical Bias
MUBARAK is standing at a critical compression point — the calm before the storm.
A confirmed breakout could open the path toward 0.06–0.086, while rejection at the trendline risks sending price back below 0.03.
Volume and daily close confirmation will determine whether bulls or bears take control next.
---
#MUBARAK #MUBARAKUSDT #CryptoBreakout #TrianglePattern #TechnicalAnalysis #Altcoin #KuCoin #CryptoTrading #SymmetricalTriangle #ChartAnalysis
✅ Get Free Signals! Join Our Telegram Channel Here: t.me/TheCryptoNuclear
✅ Twitter: twitter.com/crypto_nuclear
✅ Join Bybit : partner.bybit.com/b/nuclearvip
✅ Benefits : Lifetime Trading Fee Discount -50%
✅ Twitter: twitter.com/crypto_nuclear
✅ Join Bybit : partner.bybit.com/b/nuclearvip
✅ Benefits : Lifetime Trading Fee Discount -50%
إخلاء المسؤولية
لا يُقصد بالمعلومات والمنشورات أن تكون، أو تشكل، أي نصيحة مالية أو استثمارية أو تجارية أو أنواع أخرى من النصائح أو التوصيات المقدمة أو المعتمدة من TradingView. اقرأ المزيد في شروط الاستخدام.