📉 NAS100  NAS100
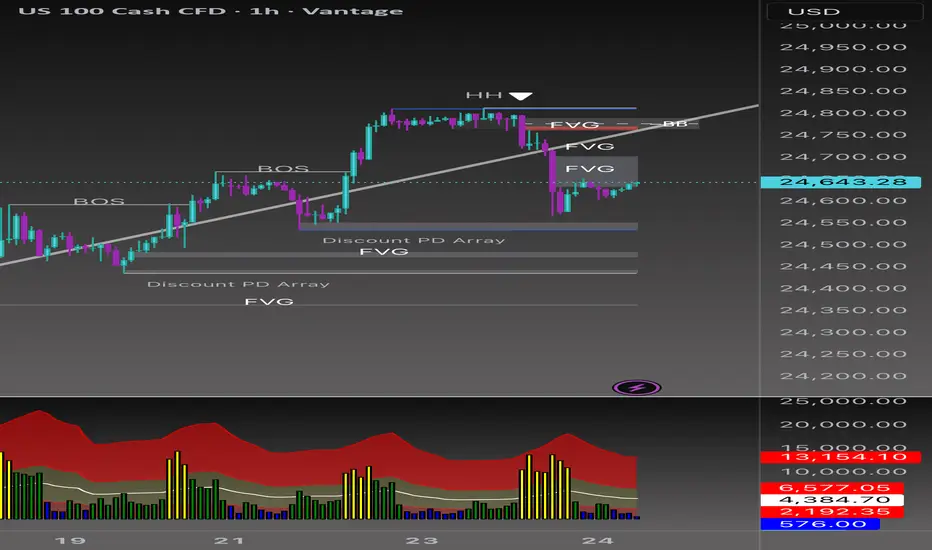
Short Bias Analysis (1H Chart)
The market recently formed a Higher High (HH) followed by a Break of Structure (BOS) to the downside, suggesting a potential bearish shift. This move left behind multiple Fair Value Gaps (FVGs), now acting as supply zones.
Key Points
• Liquidity grab above the HH, followed by strong bearish momentum.
• Two FVGs aligning with short bias.
• Current retracement into inefficiencies offers a potential short entry.
• Downside targets: Discount PD Array and lower FVGs (24,480–24,440).
Trade Idea
• Entry Zone: 24,700–24,750 (upper FVG)
• Stop Loss (SL): Above 24,800 (invalidates bearish idea)
• Take Profit 1 (TP1): 24,560
• Take Profit 2 (TP2): 24,440
Risk management remains key 🔑 if price closes above the upper FVG/BB zone, short bias is invalidated.
منشورات ذات صلة
إخلاء المسؤولية
لا يُقصد بالمعلومات والمنشورات أن تكون، أو تشكل، أي نصيحة مالية أو استثمارية أو تجارية أو أنواع أخرى من النصائح أو التوصيات المقدمة أو المعتمدة من TradingView. اقرأ المزيد في شروط الاستخدام.
إخلاء المسؤولية
لا يُقصد بالمعلومات والمنشورات أن تكون، أو تشكل، أي نصيحة مالية أو استثمارية أو تجارية أو أنواع أخرى من النصائح أو التوصيات المقدمة أو المعتمدة من TradingView. اقرأ المزيد في شروط الاستخدام.