Technical analysis for the US 100 Cash CFD (likely the **NAS100** or a similar index) on a **4-hour timeframe**.
Here is an analysis of the key elements and the projected trade setup:
## 📈 Chart Overview
* **Asset:** US 100 Cash CFD (NAS100).
* **Timeframe:** 4-hour (4H) candles.
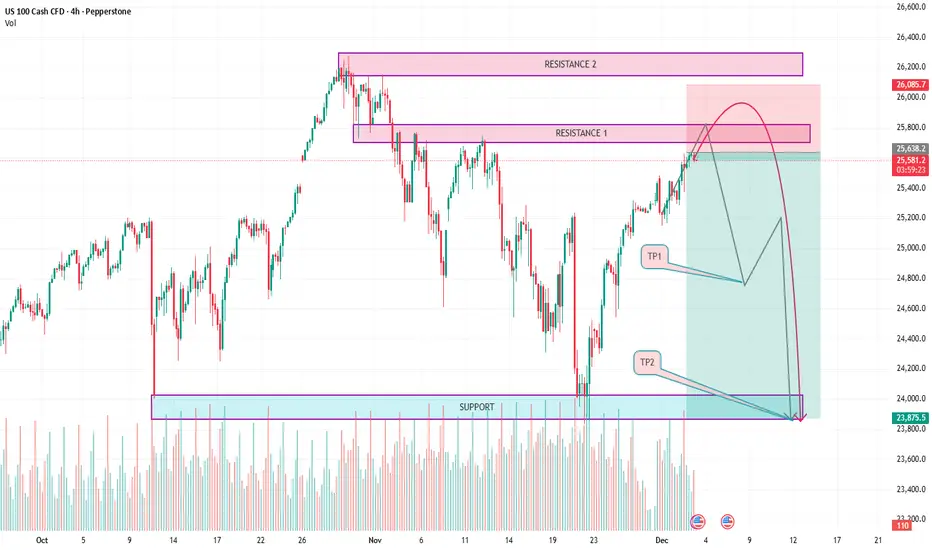
* **Current Price (as of the top left corner):** Open (O) 25,619.2, High (H) 25,638.8, Low (L) 25,568.0, Close (C) 25,570.8. The price is currently around **25,638.2**.
* **Volume:** High volatility and significant trading volume are visible at key turning points.
## 🔑 Key Levels Identified
The chart identifies three primary zones marked by horizontal boxes:
1. **Support Zone (Bottom):** A strong support level is identified between approximately **23,875.5** and **24,000**. This area marked a previous low and is the ultimate target of the projected move (TP2).
2. **Resistance 1 Zone (Middle):** An area of former resistance/support is marked around **25,700** to **25,850**. The current price is right at the top of this zone.
3. **Resistance 2 Zone (Top):** The highest resistance is identified from approximately **26,085.7** to **26,300**. This zone represents the recent peak price.
## 📉 Projected Trade Setup (Short/Sell)
The diagram illustrates a bearish or **short-selling** trade idea.
* **Trade Idea:** The general projection is a significant **downward move** from the current high area.
* **Entry Zone:** The projected entry is shown near the **Resistance 1** and slightly into the **Resistance 2** area, suggesting a wait for the price to peak out after the current rally. The proposed entry seems to be between $\text{R1}$ and $\text{R2}$, around the **25,800 - 26,000** area, where the curved path begins its descent.
* **Stop Loss (Implied):** While not explicitly marked, a stop loss would typically be placed above **Resistance 2**, perhaps slightly above the high of **26,300**.
* **Take Profit 1 (TP1):** The first target is positioned around **24,800**. This marks a moderate retracement target.
* **Take Profit 2 (TP2):** The final target is set at the main **Support Zone**, specifically at **23,875.5**.
**Projected Path:**
The chart outlines a path where the price could:
1. **Continue to rally** towards or briefly into the **Resistance 2** zone (around 26,000).
2. **Reverse sharply** (indicated by the large red curve).
3. **Descend** to **TP1** (24,800).
4. **Continue descending** to **TP2** (23,875.5) at the main support level.
Would you like me to find the current real-time price of the NAS100 or explain the concepts of support and resistance further?
Here is an analysis of the key elements and the projected trade setup:
## 📈 Chart Overview
* **Asset:** US 100 Cash CFD (NAS100).
* **Timeframe:** 4-hour (4H) candles.
* **Current Price (as of the top left corner):** Open (O) 25,619.2, High (H) 25,638.8, Low (L) 25,568.0, Close (C) 25,570.8. The price is currently around **25,638.2**.
* **Volume:** High volatility and significant trading volume are visible at key turning points.
## 🔑 Key Levels Identified
The chart identifies three primary zones marked by horizontal boxes:
1. **Support Zone (Bottom):** A strong support level is identified between approximately **23,875.5** and **24,000**. This area marked a previous low and is the ultimate target of the projected move (TP2).
2. **Resistance 1 Zone (Middle):** An area of former resistance/support is marked around **25,700** to **25,850**. The current price is right at the top of this zone.
3. **Resistance 2 Zone (Top):** The highest resistance is identified from approximately **26,085.7** to **26,300**. This zone represents the recent peak price.
## 📉 Projected Trade Setup (Short/Sell)
The diagram illustrates a bearish or **short-selling** trade idea.
* **Trade Idea:** The general projection is a significant **downward move** from the current high area.
* **Entry Zone:** The projected entry is shown near the **Resistance 1** and slightly into the **Resistance 2** area, suggesting a wait for the price to peak out after the current rally. The proposed entry seems to be between $\text{R1}$ and $\text{R2}$, around the **25,800 - 26,000** area, where the curved path begins its descent.
* **Stop Loss (Implied):** While not explicitly marked, a stop loss would typically be placed above **Resistance 2**, perhaps slightly above the high of **26,300**.
* **Take Profit 1 (TP1):** The first target is positioned around **24,800**. This marks a moderate retracement target.
* **Take Profit 2 (TP2):** The final target is set at the main **Support Zone**, specifically at **23,875.5**.
**Projected Path:**
The chart outlines a path where the price could:
1. **Continue to rally** towards or briefly into the **Resistance 2** zone (around 26,000).
2. **Reverse sharply** (indicated by the large red curve).
3. **Descend** to **TP1** (24,800).
4. **Continue descending** to **TP2** (23,875.5) at the main support level.
Would you like me to find the current real-time price of the NAS100 or explain the concepts of support and resistance further?
Daily Forex Signals & Market Insights 📉📈
Need assistance? We're here to help! 🤝
t.me/Arthur_782
Join Our Telegram Channel Today!
t.me/+3nePmmz1xGk1MzZk
t.me/+PqiIQSFLhtEyZGU0
Need assistance? We're here to help! 🤝
t.me/Arthur_782
Join Our Telegram Channel Today!
t.me/+3nePmmz1xGk1MzZk
t.me/+PqiIQSFLhtEyZGU0
منشورات ذات صلة
إخلاء المسؤولية
لا يُقصد بالمعلومات والمنشورات أن تكون، أو تشكل، أي نصيحة مالية أو استثمارية أو تجارية أو أنواع أخرى من النصائح أو التوصيات المقدمة أو المعتمدة من TradingView. اقرأ المزيد في شروط الاستخدام.