Use this as a guide to develop your own setup
Main items we can see on the 4hs chart:
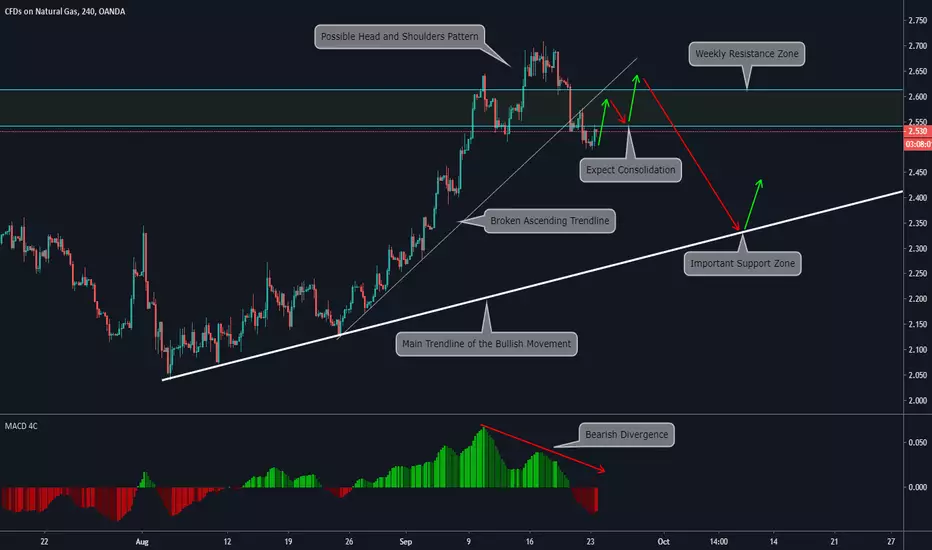
a)The price is against a Weekly resistance zone
b)We saw a clear rejection of that level
c)On MACD we can see a bearish Divergence showing the weakness of the current bullish movement
d)The current ascending trendline was broken
e)We will wait for an ABC pattern o something similar, the objective is to have a consolidation on the shown area
f)If that structure is made we will consider it as a clear Zone to short NATGAS towards the Main trendline of the bullish movement
Check the Higher timeframe analysis to make more sense of the 4hs chart
WEEKLY CHART:

DAILY CHART:

Main items we can see on the 4hs chart:
a)The price is against a Weekly resistance zone
b)We saw a clear rejection of that level
c)On MACD we can see a bearish Divergence showing the weakness of the current bullish movement
d)The current ascending trendline was broken
e)We will wait for an ABC pattern o something similar, the objective is to have a consolidation on the shown area
f)If that structure is made we will consider it as a clear Zone to short NATGAS towards the Main trendline of the bullish movement
Check the Higher timeframe analysis to make more sense of the 4hs chart
WEEKLY CHART:
DAILY CHART:
إخلاء المسؤولية
لا يُقصد بالمعلومات والمنشورات أن تكون، أو تشكل، أي نصيحة مالية أو استثمارية أو تجارية أو أنواع أخرى من النصائح أو التوصيات المقدمة أو المعتمدة من TradingView. اقرأ المزيد في شروط الاستخدام.
إخلاء المسؤولية
لا يُقصد بالمعلومات والمنشورات أن تكون، أو تشكل، أي نصيحة مالية أو استثمارية أو تجارية أو أنواع أخرى من النصائح أو التوصيات المقدمة أو المعتمدة من TradingView. اقرأ المزيد في شروط الاستخدام.