This LNG analysis was prepared by Dr. Igor Isaev in cooperation with Anastasia Volkova, LSE analyst.
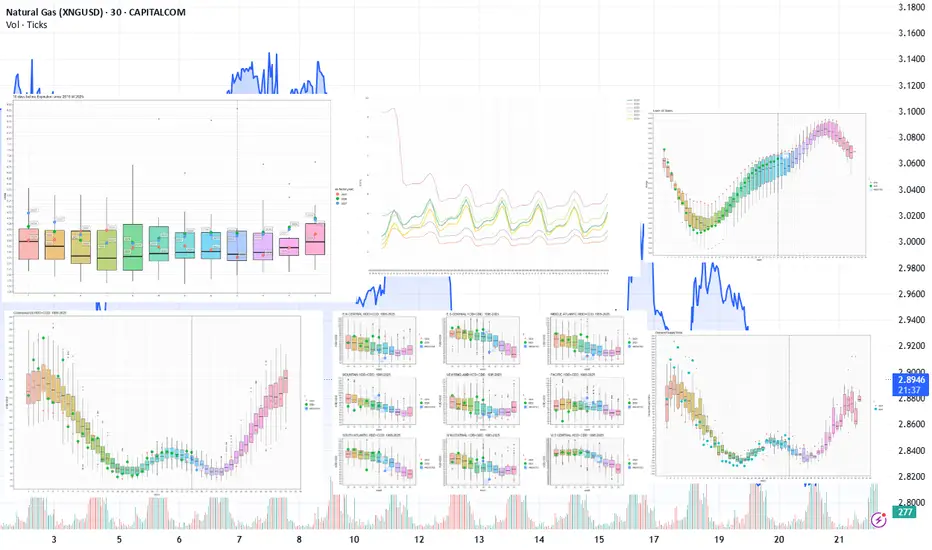
Current prices vs. price spread 10 days before expiry by month since 2010
[Top left graph]
Total monthly price decline exceeded 17%. Near-term contracts NGU25, NGV25 are trading 3-5% below the average price 10 days prior to expiration for all expired contracts over the previous 15 years. NGX25 has reached the median. Prices of 2026 and 2027 contracts are also declining and are already trading at or below the upper quantile boundary for almost all months.
Forward curve vs. 2020-2024
[The top chart in the middle]
The shape of the forward curve flattens out and comes closer and closer to the states of the curve on the same calendar day of the year as the curves of 2023, 2024. This is especially noticeable on contracts with delivery in 3 years and beyond. On contracts closer the divergence is still large.
Current inventory and forecast for next week compared to 2019-2024
[Top right graph]
For week 33 (Aug 11-17), we expect a +14BCF gain in storage. Fill rates are holding steady above the median for the previous 5 years. Injection rates remain positive, which reduces shortage risks and contributes to downward price pressure.
Weekly HDD+CDD total from current NOAA data and forecast for the next two weeks comparing 1994-2024
[Bottom left graph]
In a continental cross-section, the current week 34 weather is holding at the same level as the average values observed over the past 30 years. Next week (35), HDD+CDD values are forecast to be well below average, contributing to lower air conditioning electricity demand and downward price pressure.
Explanation of the chart: in candlesticks quantiles for 30 years from 1994 to 2024. Red dots 2024, green 2025, blue prediction 2025
Weekly HDD+CDD total from current NOAA data and forecast for the next two weeks compared to 1994-2024 by region
[The bottom chart in the middle]
Forecasts by major regions are consistent with the overall picture. Temperatures are expected to be slightly above normal in week 34 in the Eastern, Western regions followed by a decrease in week 35. In the PACIFIC region, values remain high. On the contrary, the Atlantic regions are below normal.
Weekly cumulative supply/demand difference compared to 2014-2024
[Bottom right graph]
For the past 2 weeks, the supply/demand differential has held well above the upper 10-year range. Despite record production levels, total natural gas consumption also increased due to electricity demand, the industrial sector and LNG exports.
Head of Analytics Center at the European broker Mind-Money.eu
🌐 mind-money.eu
Website
🌐 igorisaev.com/
🌐 mind-money.eu
Website
🌐 igorisaev.com/
إخلاء المسؤولية
لا يُقصد بالمعلومات والمنشورات أن تكون، أو تشكل، أي نصيحة مالية أو استثمارية أو تجارية أو أنواع أخرى من النصائح أو التوصيات المقدمة أو المعتمدة من TradingView. اقرأ المزيد في شروط الاستخدام.