📊 Current Snapshot
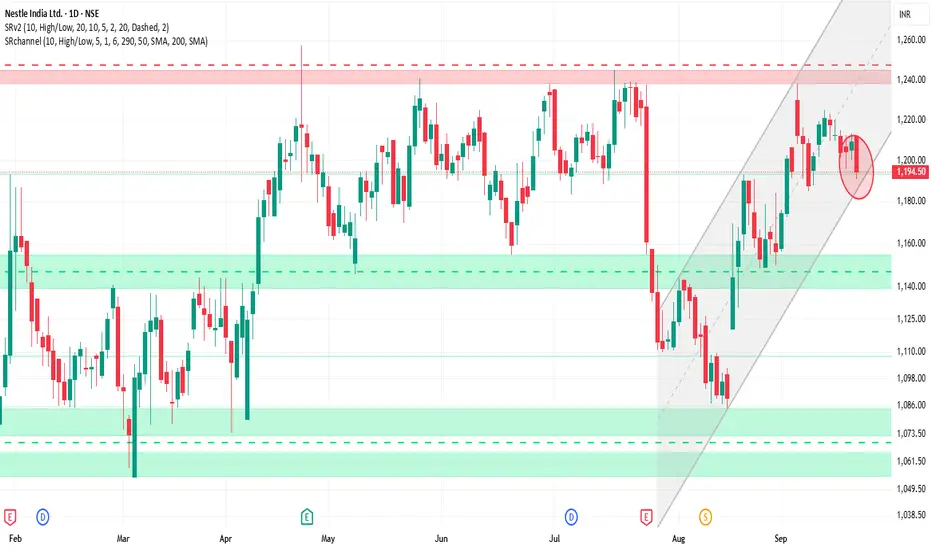
Closing Price: ₹1,194.50
Day’s Range: ₹1,190.20 – ₹1,212.00
52-Week Range: ₹1,055.00 – ₹1,389.00
Volume: Approximately 2.4 million shares traded
Market Cap: ₹2,30,337 Crores
P/E Ratio: 78.40 (reflecting premium valuation)
Dividend Yield: 2.26%
⚙️ Technical Indicators
Relative Strength Index (RSI): 47.51 – Neutral
Moving Average Convergence Divergence (MACD): -4.12 – Bearish
Moving Averages: Mixed signals; short-term averages above the current price, while long-term averages are below, indicating potential resistance.
Pivot Points: Central pivot around ₹1,194.73, suggesting a balanced market sentiment.
🎯 Potential Scenarios
Bullish Scenario: A breakout above ₹1,197.26 with strong volume could target ₹1,202.16 and higher levels.
Bearish Scenario: Failure to hold above ₹1,187.46 may lead to a decline toward ₹1,183.83.
⚠️ Key Considerations
Market Sentiment: Nestlé India has shown strong performance recently, but broader market conditions can impact its movement.
Volume Analysis: Watch for volume spikes to confirm breakout or breakdown signals.
Technical Indicators: While the RSI indicates a neutral stance, the MACD and moving averages suggest caution.
منشورات ذات صلة
إخلاء المسؤولية
لا يُقصد بالمعلومات والمنشورات أن تكون، أو تشكل، أي نصيحة مالية أو استثمارية أو تجارية أو أنواع أخرى من النصائح أو التوصيات المقدمة أو المعتمدة من TradingView. اقرأ المزيد في شروط الاستخدام.
منشورات ذات صلة
إخلاء المسؤولية
لا يُقصد بالمعلومات والمنشورات أن تكون، أو تشكل، أي نصيحة مالية أو استثمارية أو تجارية أو أنواع أخرى من النصائح أو التوصيات المقدمة أو المعتمدة من TradingView. اقرأ المزيد في شروط الاستخدام.